A steam turbine set is too large, too hot and too tied to its foundation to be carried to a test room, and it is measured where it runs, in the turbine hall, with the auxiliary plant of the station working around it. IEC 61063 is the noise test code for that job. It takes the survey method of ISO 3746 and fixes what the method leaves open for this one family of machines: the shape of the enveloping surface around a turbine, a gear or a generator and an exciter standing in a row on their operating floor, where the microphones go on it, how the background and the hall are corrected, and what the report has to say. This guide covers each step: the stepped measurement surface and its area, the key and additional microphone positions, the background correction of Table 2 and how it departs from the of ISO 3746, the environmental correction of Figure A.3 and the qualification of the hall, the surface sound pressure level and the sound power level, and the report. Which route fits other machines is weighed in Sound Power.
1. The test code (IEC 61063)
Section titled “1. The test code (IEC 61063)”The standard applies to the part of a turbine set, the turbine, the driven machinery and the components attached to them, that stands above the floor of the turbine room, inside a continuous enveloping surface bounded by that floor (clause 1.1.1). Which floor is the reflecting plane depends on how the set is mounted. A continuous, reflecting operating floor is; an operating floor near the horizontal centreline of a large set is too, as long as it has no openings through which the noise radiated beneath it reaches the microphones (1.1.2). An open grating, a floor with openings near the set, or walkways around it are not, and the foundation floor becomes the plane (1.1.3); the plant beneath then contributes so much at the microphones that the sound power level is no longer valid, unless the openings are blocked with panels during the test. Noise control treatments fitted to the set, enclosures or screens, are reported by type, location and extent (1.1.5).
The method is the survey grade of ISO 3746 (Introduction), and Table 1 gives the standard deviation its sound power levels tend to stay within: 5 dB for a source with prominent discrete tones and 4 dB for one whose sound is spread evenly over frequency. When the method compares similar machines that are omnidirectional and radiate broadband noise, measured in similar halls, NOTE 1 puts the standard deviation of that comparison at 3 dB or less. IEC 61063 was written against the 1979 edition of ISO 3746; the library’s ISO 3746 is the 2010 edition, and where this guide sets the two side by side it says so.
How the measurement goes
Section titled “How the measurement goes”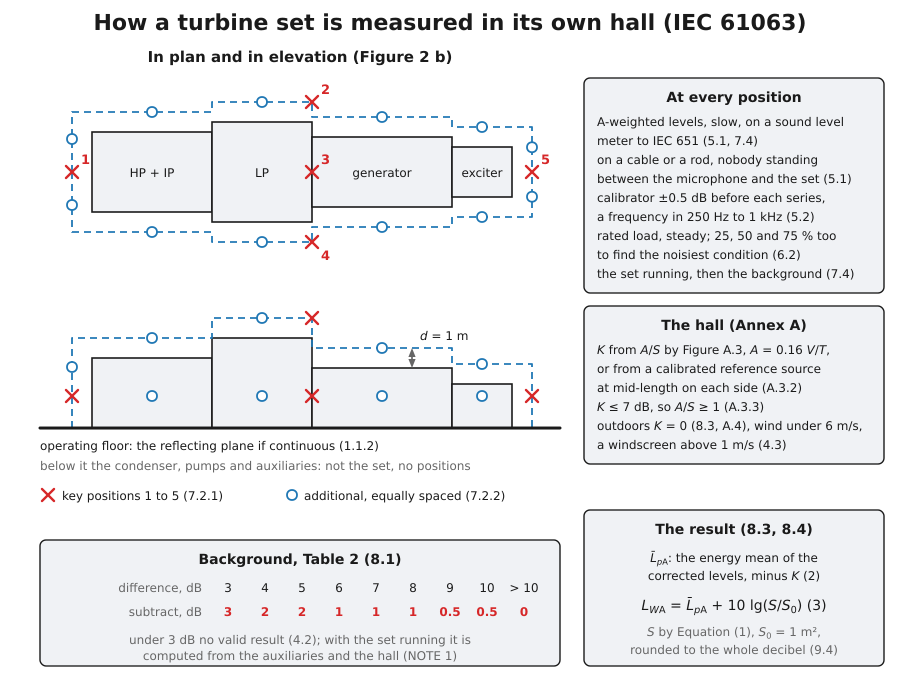
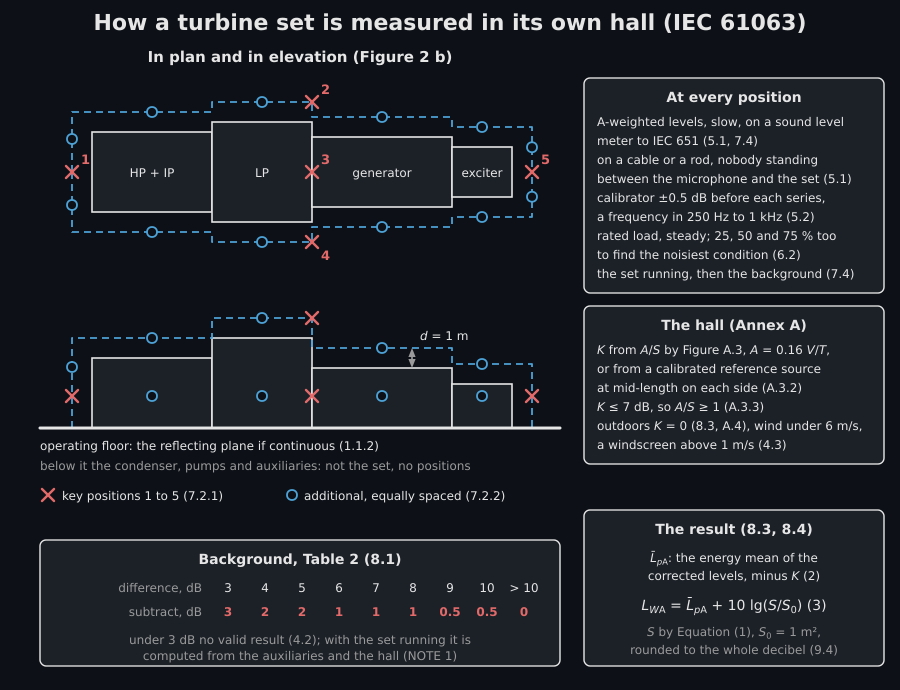
- Enclose each part of the set in a reference box, the smallest box that just holds it with its lagging and any screen, standing on the reflecting plane (7.1). The measurement surface is the set of parallelepipeds 1 m out from the boxes.
- Place the five key positions of Figure 2 on it and the additional positions between them, at equal distances, close enough that every casing has a measurement section (7.2). The overhead ones may be left out if a preliminary run shows they move the result by no more than 1.0 dB.
- With the set in a steady operating condition under rated load (and, to find the noisiest condition, at 25 %, 50 % and 75 % as well, 6.2), read the A-weighted level at each position with a sound level meter to IEC 651 on the slow time weighting, calibrated before each series with a calibrator good to dB (5.1, 5.2, 7.4).
- Get the background at each position. With the turbine running it can rarely be measured, and NOTE 1 of 8.1 lets it be computed from the sound power of the auxiliary plant and the reflections of the hall.
- Qualify the hall: the environmental correction , from its reverberation time or from a calibrated reference sound source, may not exceed 7 dB (Annex A). Outdoors is zero, and the wind has to stay below 6 m/s (4.3, A.4).
- Compute the corrected levels (Table 2), the surface sound pressure level (Equation (2)) and the sound power level (Equation (3)), and write the report of clause 10.
2. The measurement surface
Section titled “2. The measurement surface”The parallelepipeds of the measurement surface run parallel to the reference boxes at the measurement distance , and “the measurement distance () is 1 m” (7.1): each is 2 m wider and 1 m taller than its box, and the first and the last are 1 m longer, at the two ends of the set. Figure 2 dimensions them on the measurement surface, and Equation (1) gives its area:
with , and the length, width and height of the -th of the
parallelepipeds. The sum is the tops and the long sides; the first term stands
for every transverse face, the two ends and the steps between neighbours. It
is the exact area when the sections shrink from one largest section towards
both ends, each containing the next, which is how both drawings of Figure 2
are built. Otherwise it is not: it counts too much when the tallest and the
widest boxes are different ones, and too little when a small section stands
between two large ones. enveloping_area_m2 sums the stepped surface face by
face for that case. A single box gives the enveloping parallelepiped of
ISO 3746, .
The set of this guide is the one Figure 2 b draws: the HP and IP casings in one box, the LP turbine in its own, then the generator and the exciter.
from phonometry import emission
boxes = [                      # length, width, height above the floor [m]    emission.TurbineReferenceBox(6.0, 4.0, 3.5, "HP-IP"),    emission.TurbineReferenceBox(5.0, 5.0, 4.5, "LP"),    emission.TurbineReferenceBox(7.0, 3.5, 3.0, "Generator"),    emission.TurbineReferenceBox(3.0, 2.5, 2.2, "Exciter"),]surface = emission.turbine_measurement_surface(boxes)print(surface.lengths_m, surface.widths_m, surface.heights_m)# [7. 5. 7. 4.] [6.  7.  5.5 4.5] [4.5 5.5 4.  3.2]print(round(surface.area_m2, 1), round(surface.enveloping_area_m2, 1))   # 410.1 410.1
3. The microphone positions
Section titled “3. The microphone positions”Figure 2 prescribes five key positions (7.2.1): 1 and 5 at the centres of
the two ends, 2 and 4 on the two long sides and 3 overhead, the last three in
the plane between the turbine and the driven machinery. In Figure 2 a that is
the plane after the turbine box; in Figure 2 b, between the LP turbine and the
generator, so the library takes the number of boxes on the turbine side
(turbine_boxes) and puts 2, 3 and 4 at the outer corner of the wider (and
taller) of the two parallelepipeds that meet there, as both drawings do.
The additional positions start at the key positions and are “arranged at
equal distances”, such “that there is at least one measurement section at
each casing” (7.2.2). The library walks two paths, as the plans and the
elevations of Figure 2 draw them: round the sides at the microphone height,
from 1 through 2, 5 and 4 back to 1, and the overhead line in the vertical
plane of the shaft, from 1 up the front end, across the top and its steps to
3, and on to the rear end and down it to 5 (both elevations put a position on
the front end above key position 1). It divides each run between key
positions into the fewest equal intervals no longer than spacing_m, and
stands a position at every division. The two paths are divided each on its
own, so their stations need not stand in the same transverse sections, as the
drawings of Figure 2 happen to put them; 7.2.2 asks only for equal distances.
The “measurement section at each casing” is checked per parallelepiped: a
spacing that leaves one without a position on its long sides emits a
SoundPowerWarning, and where one box holds two casings, as the HP and IP
turbines do here, whether both are reached is read from positions_m. The
height of the row round the sides is yours: Figure 2 draws it without
dimensioning it. The NOTE of 7.2.2
lets the overhead positions be deleted, for safety or cost, once a
preliminary run has shown they change the sound power level by no more than
1.0 dB (section 6), and include_overhead=False leaves them out.
array = emission.turbine_microphone_positions( surface, microphone_height_m=1.5, spacing_m=4.0, turbine_boxes=2)print(array.count, int(array.overhead_mask.sum())) # 23 7print(array.positions_m[array.key_mask])# [[ 0. 0. 1.5] key position 1# [12. 3.5 1.5] 2# [23. 0. 1.5] 5# [12. -3.5 1.5] 4# [12. 0. 5.5]] 3print(array.positions_per_box, array.every_box_sampled) # (2, 2, 2, 1) Truearray.plot() # plan; array.plot(view="elevation") from the side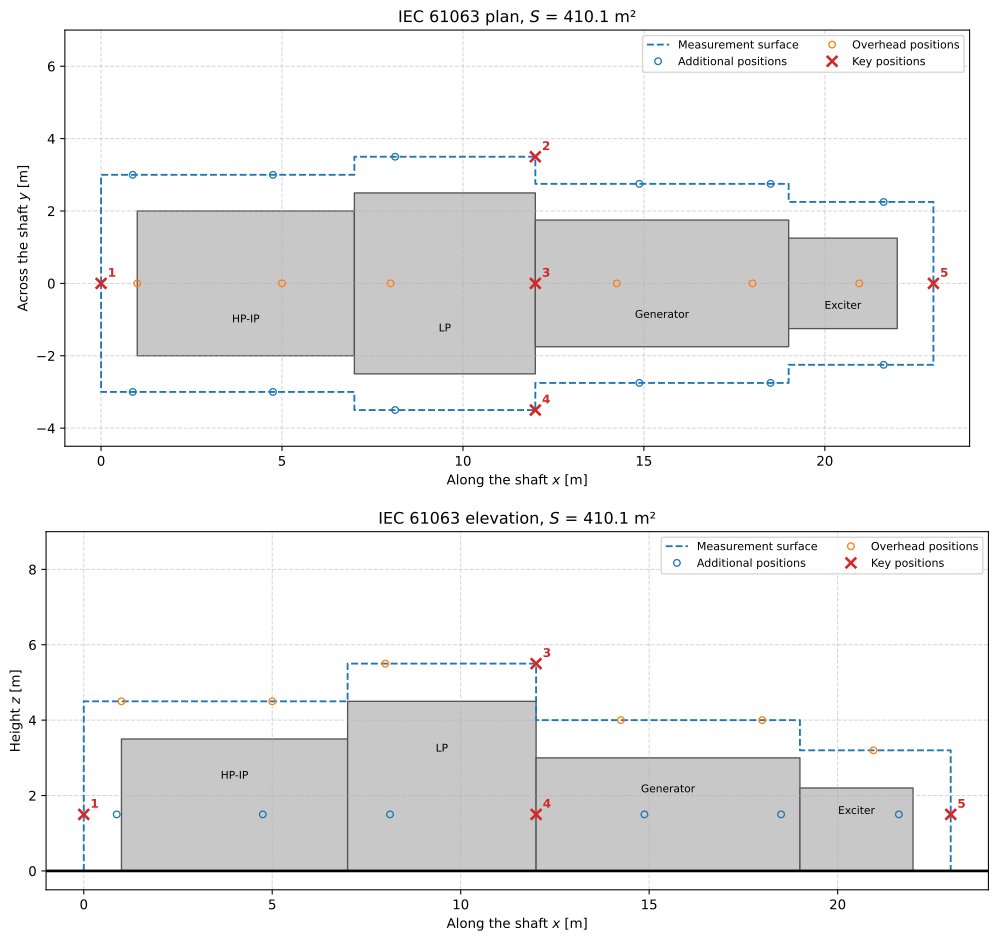
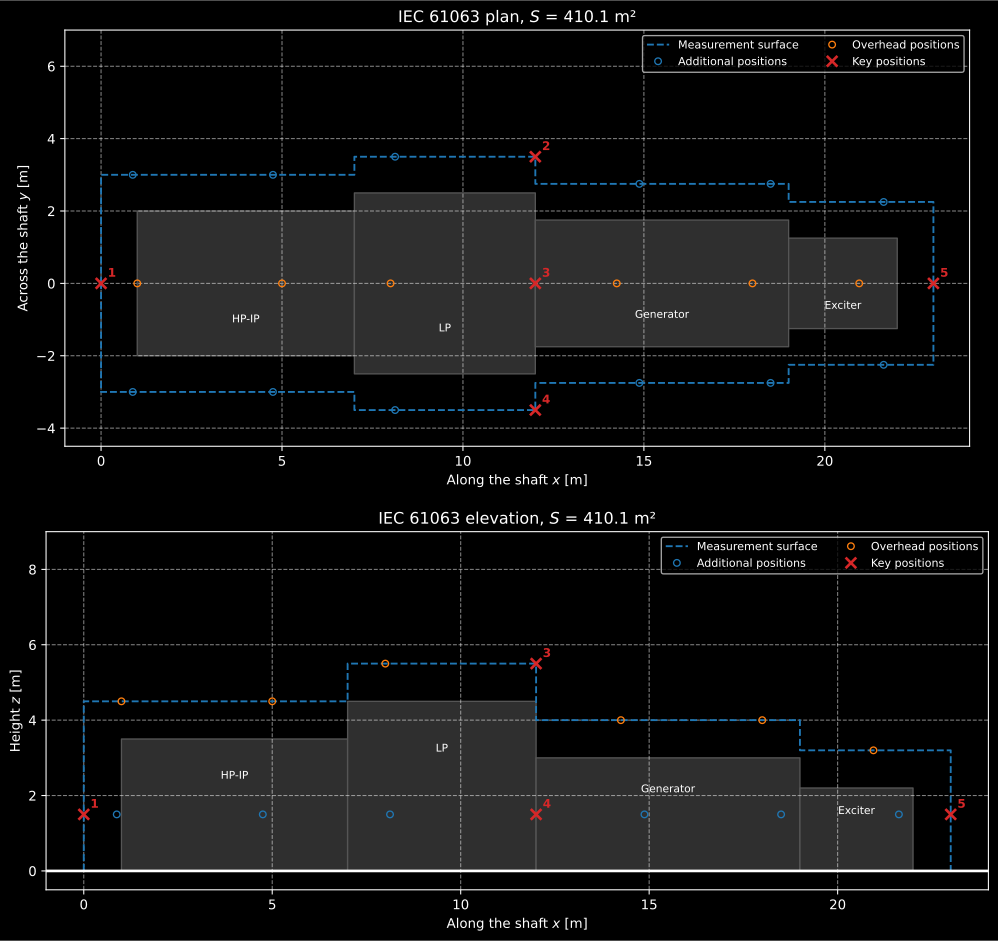
The surface around the set of Figure 2 b, 410.1 m², and the 23 positions of a 4 m spacing: 16 round the sides at 1.5 m and 7 on top. The plan shows both long sides and the overhead line on the shaft; the elevation shows the side of key position 4, as both elevations of Figure 2 do, and the top, which is where key position 3 stands.
4. The background correction: Table 2 against ISO 3746
Section titled “4. The background correction: Table 2 against ISO 3746”Each position’s level is corrected for the background before it is averaged (8.1), and the correction is read from Table 2:
| Level with the source operating less the background (dB) | Correction to subtract (dB) |
|---|---|
| 3 | 3 |
| 4 | 2 |
| 5 | 2 |
| 6 | 1 |
| 7 | 1 |
| 8 | 1 |
| 9 | 0.5 |
| 10 | 0.5 |
| > 10 | 0.0 |
turbine_background_correction judges the last row first, on the difference
as measured: anything above 10 dB is ”> 10” and takes no correction, 10.2 dB
as much as 11 dB. Between 3 and 10 dB the table is printed in whole decibels,
so the difference is rounded to the nearest one, halves upwards, before it is
read, and 9.5 to 10 dB takes the 0.5 dB of the row 10; the library reads the
stepped table of ISO/TS 7849-1 the same way. Below 3 dB there is no row: the
background “should be at least 3 dB below” (4.2), and under that “a valid
measurement of the machine under test cannot be made”. The function returns
the 3 dB of the first row there, which still leaves an upper limit, since the
exact correction for a smaller difference is larger, and that is how the
NOTE of 4.2 lets such a result be used. It is also the value ISO 3746:2010
prints for the same case.
print(emission.turbine_background_correction([3.0, 4.0, 5.0, 6.0, 9.0, 10.0, 11.0]))# [3. 2. 2. 1. 0.5 0.5 0. ]print(emission.turbine_background_correction([4.4, 4.5, 9.5, 10.0, 10.2]))# [2. 2. 0.5 0.5 0. ]ISO 3746:2010 corrects the background with a formula instead, Equation (12) of clause 8.3.3,
taken as zero above 10 dB and as 3 dB below 3 dB, and it applies it once, to the difference between the surface-averaged levels, where IEC 61063 corrects each position before the average. At the differences Table 2 prints, the two agree within 0.35 dB: the steps lead the formula at 5 dB (2 against 1.65) and at 8 dB (1 against 0.75), and trail it at 4 dB (2 against 2.20) and at 6 dB (1 against 1.26). Between the rows, where a measured difference usually falls, the rounding moves them further apart, from 0.57 dB below the formula at 3.5 dB to 0.56 dB above it just short of 5.5 dB. Above 10 dB neither subtracts anything.
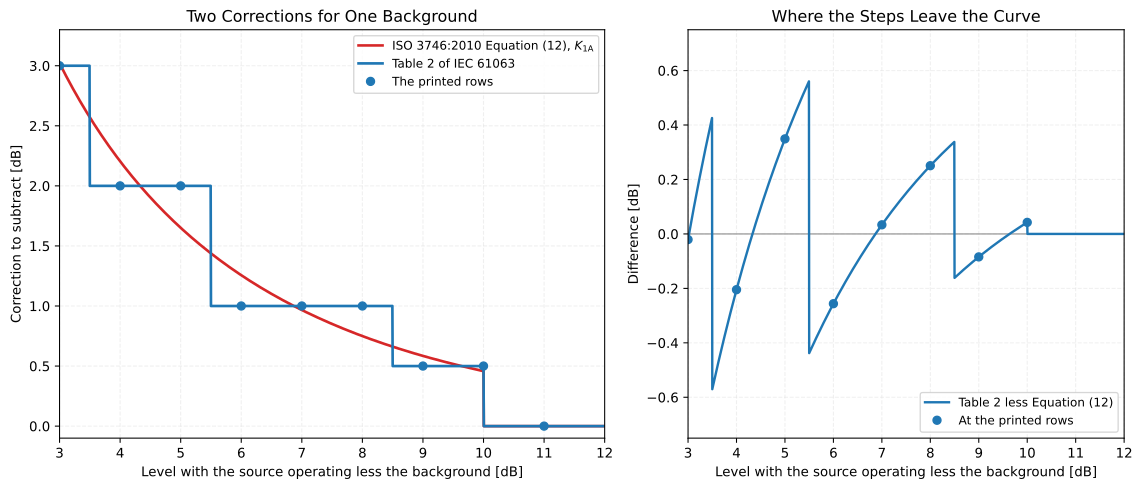
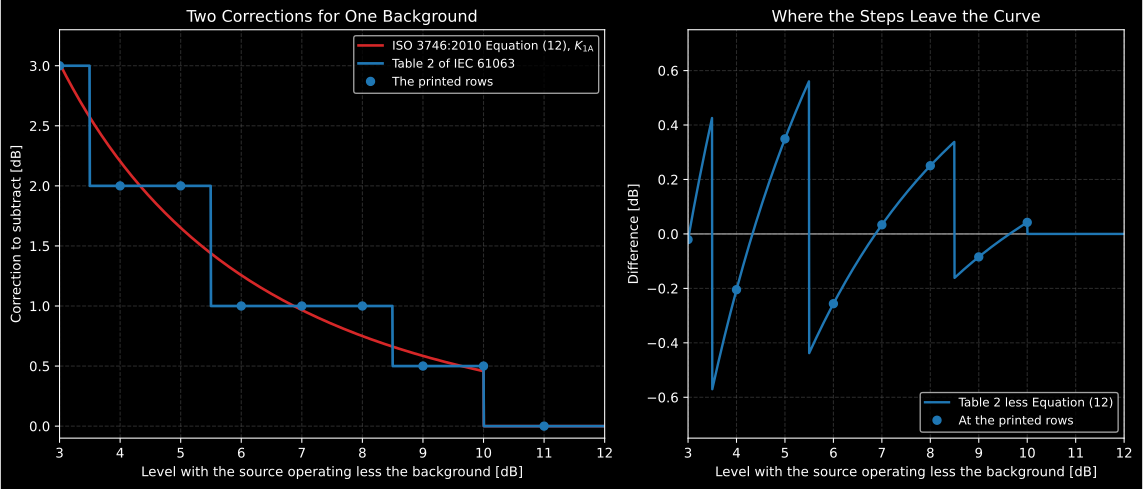
The same background, two corrections. Table 2 read in whole decibels is a staircase over the curve of ISO 3746:2010 Equation (12); its printed rows sit within 0.35 dB of the curve, and the rounding between them within 0.6 dB.
5. The environmental correction and the hall
Section titled “5. The environmental correction and the hall”The reflections of the hall raise the levels on the surface, and the environmental correction takes them off (8.2). Figure A.3 prints the curve and its formula,
the of ISO 3744 and ISO 3746, with the equivalent absorption area of
the hall from its reverberation time, , measured with
broadband noise or an impulse and A-weighting on the receiving side (A.3.1).
The hall qualifies when does not exceed 7 dB (8.3, A.3.3), which the
clause restates as . The two agree to the whole decibel the limit
is printed in: the curve gives dB at and reaches
7 dB at . check_turbine_test_environment judges the 7 dB,
from the correction itself or from a bare environmental_correction_db
(0 outdoors).
A.3.2 offers a second route: a reference sound source calibrated in a free field over a reflecting plane, whose sound power level is set against the level it shows in the hall by the method of ISO 3746 with taken as zero, so . By its NOTE, is the mean of two determinations, the source in the middle of each long side of the set, and a machine longer than 10 m takes two more, at the ends. Outdoors, and in very large halls or halls that are not closed, is zero (A.4), and the wind has to stay below 6 m/s, with a windscreen above 1 m/s (4.3).
room = emission.turbine_environmental_correction(    surface.area_m2, volume_m3=60_000.0, reverberation_time_s=3.2)print(room.absorption_area_m2, round(room.ratio, 2),      round(room.environmental_correction_db, 2))           # 3000.0 7.32 1.89print(emission.check_turbine_test_environment(room).passes)  # True
source = emission.turbine_reference_source_correction(    [95.6, 96.3, 95.9, 96.8], calibrated_level_db=94.2, machine_length_m=21.0)print(round(source.environmental_correction_db, 2))           # 1.95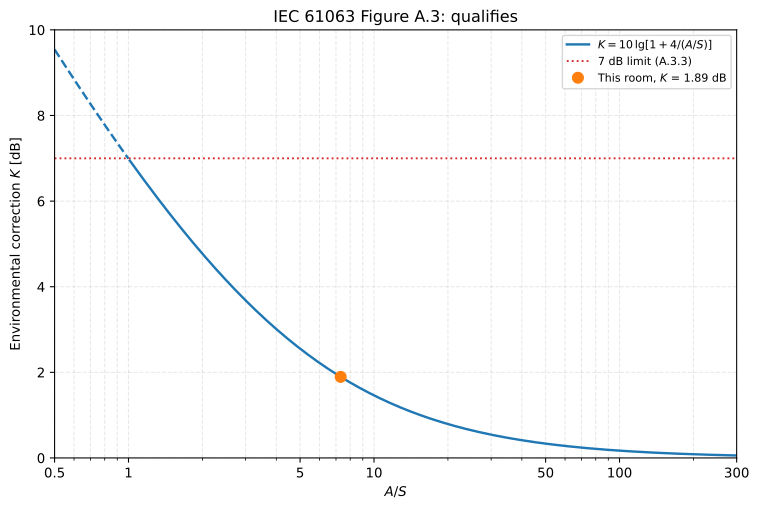
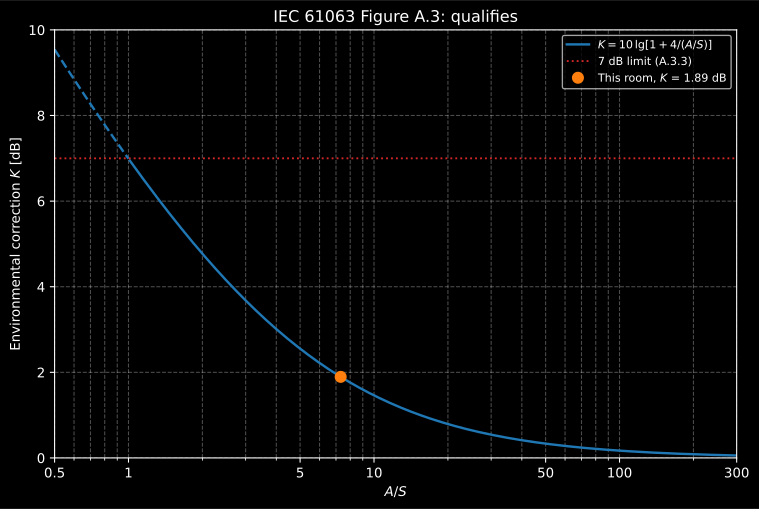
Figure A.3 with the hall of the example on it: 60 000 m³ and 3.2 s give 3000 m² of absorption, an of 7.3 and a of 1.89 dB, well inside the 7 dB of A.3.3.
6. The surface level and the sound power level
Section titled “6. The surface level and the sound power level”The corrected levels are energy-averaged and is subtracted, Equation (2),
and the surface term gives the sound power level, Equation (3), with m². The level is recorded to the nearest whole decibel (9.4 g).
import numpy as np
levels = np.array([         # dB re 20 uPa, in the order of array.positions_m    91.8, 93.1, 93.6, 94.2, 93.0, 90.4, 89.7, 88.2, 87.5, 88.6, 90.1, 90.9,    93.4, 94.6, 93.9, 92.7, 92.2, 94.0, 95.1, 93.8, 90.6, 89.3, 87.9])background = np.array([     # computed from the auxiliary plant (8.1, NOTE 1)    84.0, 84.2, 84.5, 84.8, 85.0, 83.2, 82.5, 81.4, 80.6, 81.3, 82.9, 83.4,    85.0, 84.8, 84.5, 84.2, 83.0, 83.0, 83.0, 83.0, 83.0, 82.0, 81.0])full = emission.turbine_sound_power(    levels, surface_area_m2=surface.area_m2, background_levels_db=background,    environmental_correction_db=room.environmental_correction_db,    overhead_mask=array.overhead_mask)print(round(full.surface_pressure_level_db, 2),      round(full.sound_power_level_db, 2))                   # 89.78 115.91print(full.reported_sound_power_level_db)                    # 116.0print(round(full.overhead_effect_db, 2), full.overhead_may_be_deleted)  # 0.27 Trueprint(round(full.level_range_db, 1), full.arithmetic_mean_allowed)      # 8.6 Falsefull.plot(position_labels=array.labels)   # the key bars numbered as in Figure 2
The differences from the background run from 6.8 to 12.1 dB, so Table 2 takes 1 dB off thirteen positions, 0.5 dB off seven and nothing off three. The seven overhead positions raise the level by 0.27 dB, well within the 1.0 dB that would let a later run on the same set leave them out.
The NOTE of 8.3 allows a plain arithmetic average in place of Equation (2)
when the position levels span no more than 5 dB, and says the average should
not differ from Equation (2) by more than 0.7 dB. For a fixed range the energy
average leads the arithmetic one most when the levels sit at the two ends of
the range, and the worst of those sets, two levels 5 dB apart with the louder
at 41 % of the positions, puts them 0.707 dB apart: the NOTE’s figure to its
one decimal. Here the levels span 8.6 dB, so the note does not apply
(arithmetic_mean_allowed is False).
A lighter load lowers the level without lowering the background. At a quarter of the rated load, 4.5 dB quieter, eight positions come within 3 dB of the background, and the result is only an upper limit:
import warnings
with warnings.catch_warnings():    warnings.simplefilter("ignore", emission.SoundPowerWarning)    quarter = emission.turbine_sound_power(        levels - 4.5, surface_area_m2=surface.area_m2,        background_levels_db=background,        environmental_correction_db=room.environmental_correction_db)print(quarter.upper_limit, quarter.conforms)                 # True False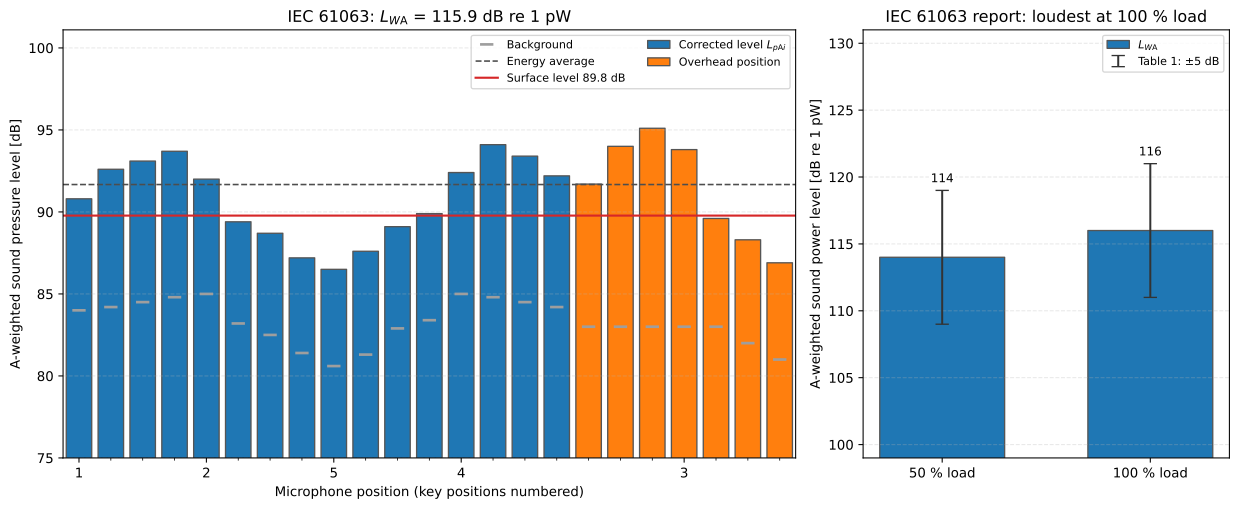
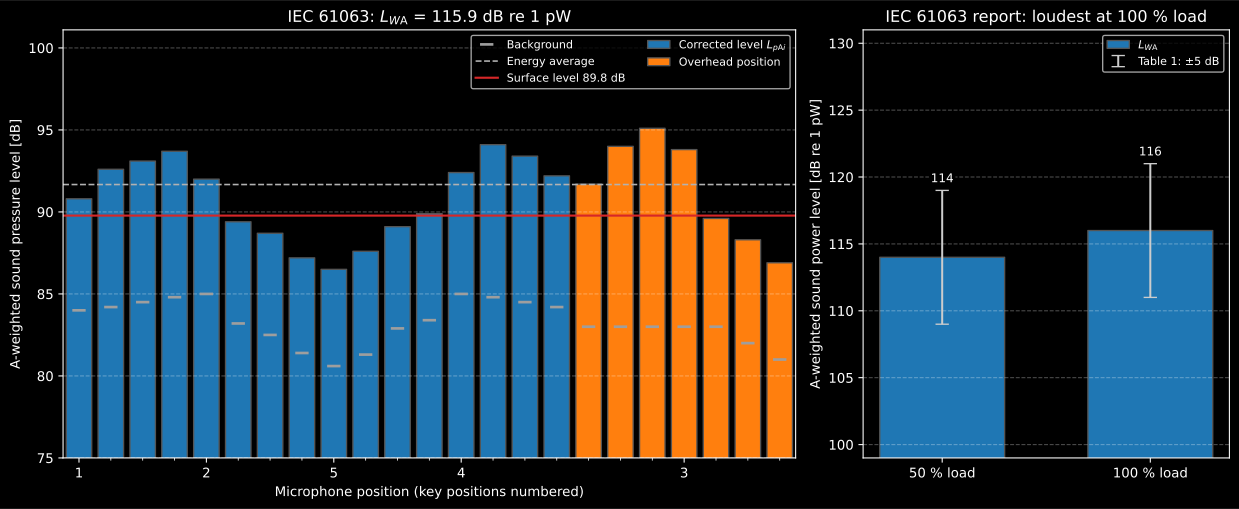
The full-load run position by position, and the report of the two loads. The Table 2 correction has already come off each bar; the gap between the dashed and the red line is the environmental correction of the hall.
7. The report
Section titled “7. The report”Clause 10 asks the report to state that the A-weighted sound power level “has
been obtained in full conformity with the procedures of this standard and
that this level is expressed in decibels above 1 pW”, and to give at least:
the turbine with its noise control screens and enclosures, the operating
conditions, the A-weighted levels at each position corrected for the
background, the surface sound pressure level, the sound power level, and the
date and time of the measurements. turbine_noise_declaration builds it from
one determination per operating condition. It keeps each sound power level as
determined and gives it in the report to the whole decibel, finds the loudest
condition on the levels before that rounding, so two loads that round to the
same decibel are still told apart, and carries the standard deviation of
Table 1 for the kind of sound. A determination that is not in full conformity,
an upper limit or a hall beyond 7 dB, cannot carry the statement and is
refused with a ValueError.
half = emission.turbine_sound_power( levels - 1.5, surface_area_m2=surface.area_m2, background_levels_db=background, environmental_correction_db=room.environmental_correction_db, overhead_mask=array.overhead_mask)report = emission.turbine_noise_declaration( {"50 % load": half, "100 % load": full}, turbine="Three-casing condensing set, 60 MW, with generator and exciter", noise_control="none", measured_at="2026-09-25, 10:30 to 12:10", tonal=True)print(report.reported_sound_power_levels_db) # (114.0, 116.0)print(report.loudest_condition, report.standard_deviation_db) # 100 % load 5.0print(report.statement)report.plot()turbine_sound_power() parameters
Section titled “turbine_sound_power() parameters”| Parameter | Type | Units | Range / default | Notes |
|---|---|---|---|---|
pressure_levels_db | 1D array | dB | at least 4 positions | with the set operating |
surface_area_m2 | float | m² | positive | of Equation (1) |
background_levels_db | 1D array or None | dB | required | One per position; None states that none was determined |
environmental_correction_db | float | dB | required | ; 0 outdoors; a value above 7 dB warns |
overhead_mask | bool array | None | For overhead_effect_db (NOTE of 7.2.2) |
What this guide covers
Section titled “What this guide covers”Covered
The IEC 61063:1991 determination of the A-weighted sound power level of a steam turbine set: the stepped measurement surface 1 m out and its area by Equation (1) (with the exact stepped area beside it), the five key positions of Figure 2 and the additional positions at equal distances with the check of 7.2.2 made per reference box, the stepped background correction of Table 2 per position, the environmental correction of Figure A.3 from the reverberation time or from a reference sound source (A.3.2), the 7 dB qualification of A.3.3 and the wind limit of 4.3, the surface sound pressure level and the sound power level of Equations (2) and (3), the arithmetic average of the NOTE of 8.3, the overhead deletion test of 7.2.2, the whole-decibel rounding of 9.4 g, the report of clause 10 and the standard deviations of Table 1.
Not covered
The instruments are assumed right: the IEC 651 sound level meter on the slow time weighting, the calibrator of 5.2 and the placement that keeps steam, air and fields off the microphone (7.4) are the operator’s. The reflecting plane is not checked against A.2.1 (absorption below 0.1, 4 m beyond the surface), the height of the row of microphones is the caller’s because Figure 2 does not dimension it, and the determinations of a reference source are made with the ISO 3746 method (
sound_power_pressure(grade="survey")) before they are passed. How the plant below the operating floor or around the set reaches the microphones (1.1.3) is outside the standard, and so outside the library. Every reference box is taken as centred on one shaft line, so a set whose boxes are flush on one long side and step only on the other, as Figure 2 a draws one, is modelled symmetrically; Equation (1) does not change. The side row and the overhead line are divided each on its own, not in the aligned transverse sections the drawings of Figure 2 show, and a reference box that holds several casings is checked as one.
References
Section titled “References”- International Electrotechnical Commission. (1991). Acoustics — Measurement of airborne noise emitted by steam turbines and driven machinery (IEC 61063:1991). Read in its English adoption, BS EN 61063:1996, the text of EN 61063:1996, which is IEC 1063:1991 without modification. Equations (1) to (3), Tables 1 and 2, Figure 2, the Figure A.3 of Annex A and the report of clauses 9 and 10 that this guide implements.
- International Organization for Standardization. (2010). Acoustics — Determination of sound power levels and sound energy levels of noise sources using sound pressure — Survey method using an enveloping measurement surface over a reflecting plane (ISO 3746:2010). The survey method IEC 61063 is built on (it cites the 1979 edition), and the background correction K1A of Equation (12), clause 8.3.3, that Table 2 is compared with.