A hair dryer, a blender, a desktop printer, a power drill: small sources that can be carried into a room built for them. ISO 3743 measures their sound power at engineering grade 2 in two such rooms. Part 1 asks almost nothing of the room, an ordinary hard-walled one, and pays for it with a calibrated reference sound source at every determination: the source and the reference source are heard at the same microphones, and the room drops out of the difference. Part 2 builds the room instead, a special reverberation test room whose reverberation time follows a prescribed curve, so that the sound power can be read off the mean room level alone; a comparison method is kept beside it. This guide covers the room qualification of both parts, the background corrections, the source-location surveys, the determinations, the reproducibility of Tables 3 and 5 and the reference meteorological conditions. Which route fits which job is weighed in Sound Power.
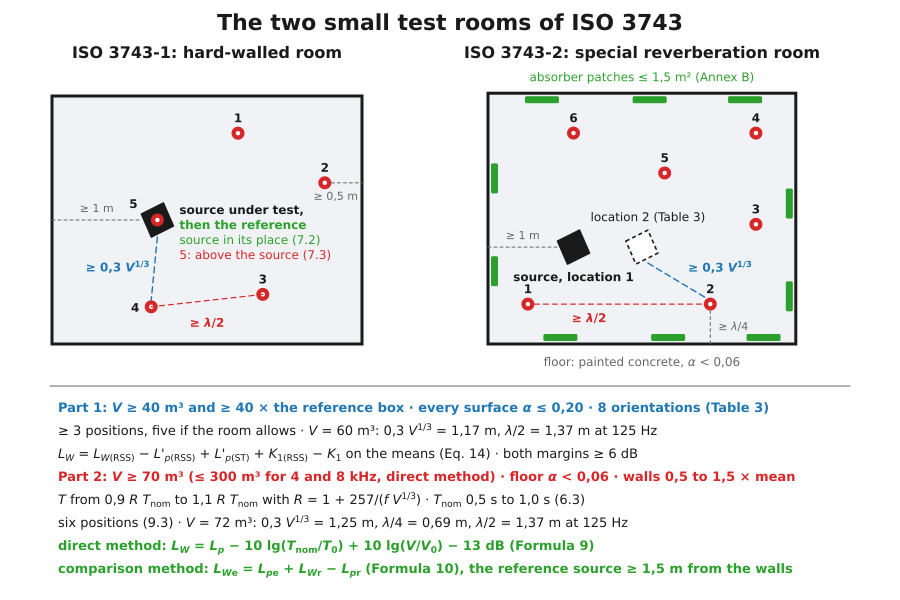
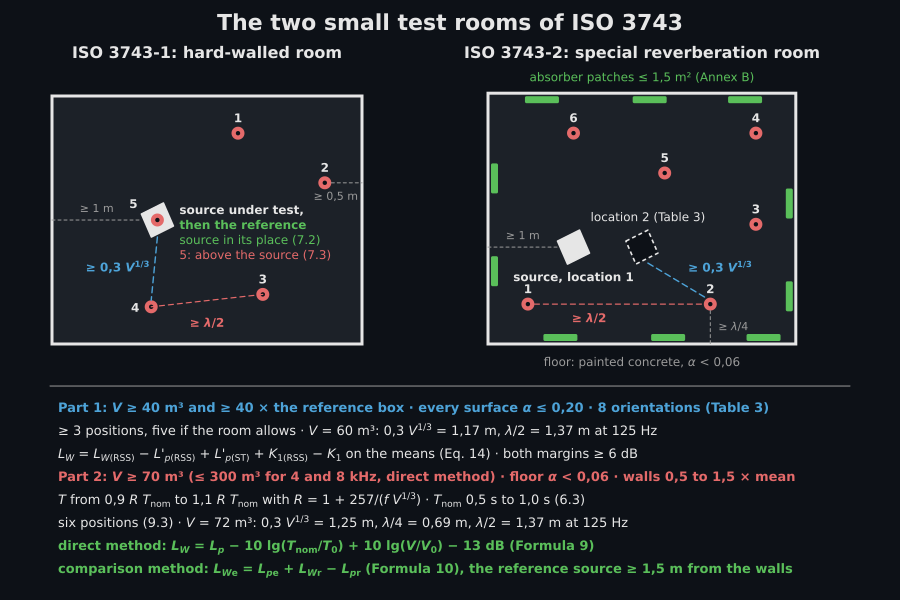
The two rooms in plan, each the room of the guide’s worked example. Part 1 asks little of the room and carries a reference source to where the source stood; Part 2 builds the room so that its reverberation time follows a curve, and reads the power from the room level alone.
1. The hard-walled room and the reference source (ISO 3743-1)
Section titled “1. The hard-walled room and the reference source (ISO 3743-1)”The room. Clause 4 asks for a room of at least 40 m³ and at least forty times the reference box, the smallest box that encloses the source and its table; in a room of up to 100 m³ the largest dimension of the box is at most 1,0 m, and 2,0 m above that (4.2). No portion of any wall, the floor or the ceiling may absorb more than 0,20 at any frequency of interest (4.3): a nearly empty room with smooth concrete, brick, plaster or tile is the model. What qualifies it acoustically is 4.4: a highly directional broadband source, directivity index at least 5 dB above 500 Hz, is turned through four horizontal and four vertical orientations, and in every octave band from 125 Hz to 8 kHz the largest difference between the eight mean levels may not exceed the standard deviation of reproducibility of Table 3.
import numpy as npfrom phonometry import emission
# A bench-top blender on a small test table, in a 5.0 m x 4.0 m x 3.0 m room# with painted concrete walls and a terrazzo floor. The reference box, table# included, is 0.5 m x 0.4 m x 0.9 m.freqs = np.array([125.0, 250.0, 500.0, 1000.0, 2000.0, 4000.0, 8000.0])orientations = np.array([  # 4.4: a directional source, mean level per orientation    [71.2, 74.0, 76.1, 77.3, 76.0, 73.1, 68.2],   # four horizontal ...    [72.4, 73.1, 75.4, 76.6, 75.2, 72.6, 67.4],    [70.3, 74.6, 76.3, 77.0, 76.4, 73.5, 68.9],    [71.9, 73.6, 75.7, 76.2, 75.5, 72.4, 67.8],    [72.8, 74.3, 76.8, 77.1, 76.3, 73.6, 69.0],   # ... and four vertical    [70.8, 73.3, 75.9, 76.5, 75.6, 72.9, 68.1],    [71.5, 74.9, 76.2, 77.5, 75.9, 73.3, 68.6],    [72.1, 73.9, 75.5, 76.8, 76.2, 73.0, 67.9],])room = emission.check_hard_walled_room(    orientations, freqs, volume_m3=60.0, reference_box_m=[0.5, 0.4, 0.9],    absorption_coefficients=[0.02, 0.03, 0.05, 0.08, 0.12],)print(np.round(room.level_range_db, 1))           # [2.5 1.8 1.4 1.3 1.2 1.2 1.6]print(room.limit_db)                              # [3.  2.  1.5 1.5 1.5 1.5 2.5]print(room.passes)                                # Trueprint(round(room.minimum_microphone_distance_m, 2))  # 1.17 m from the source (7.3)
Table 3 prints its middle octave row as “400 to 5 000”, a one-third-octave range it kept from the ISO 3744 table it was converted from; the library reads the row as the octaves it spans, 500 Hz to 4 kHz (see the errata). The last line is the of 7.3 that keeps every microphone in the reverberant field, stated for the setup rather than judged.
How many source locations. A source with audible tones or narrow bands of noise is surveyed first (7.4): at least six fixed positions record its uncorrected level, and the standard deviation per band about their arithmetic mean (Eq. 7, 8) sets the number of source locations of Table 2: one up to 2,5 dB, two in the same room up to 4,0 dB, and above that two more in a second room of different dimensions.
survey = np.array([ # 7.4: six positions, the blender running, dB [84.1, 86.0, 88.2, 90.1, 87.4, 83.2, 78.1], [82.6, 85.1, 87.5, 89.6, 88.0, 83.9, 77.5], [83.3, 86.8, 88.9, 90.8, 86.9, 82.8, 78.6], [85.0, 85.6, 87.8, 89.2, 87.7, 84.4, 77.9], [82.9, 86.3, 88.4, 90.5, 88.3, 83.5, 78.3], [84.4, 85.4, 87.1, 91.4, 87.2, 83.0, 77.6],])plan = emission.hard_walled_source_locations(survey, freqs)print(np.round(plan.standard_deviation_db, 2)) # [0.93 0.63 0.65 0.8 0.52 0.6 0.42]print(plan.required_source_locations) # 1The comparison. The source runs, then the reference sound source runs where the source stood (7.2), and both are read at the same three or more positions, with the background just before or after (7.3, 7.5). Each set is energy-averaged over the positions (Eq. 10 to 12), and over the source locations first when there are several (Eq. 9). The background is corrected once per band, on the means and not position by position (8.1.3):
with nothing to correct above 15 dB and, below 6 dB, a fixed 1,3 dB,
the value at 6 dB, with the band reported as an upper bound: the fixed
correction is smaller than Eq. 13 would take, so the level reads high. The
same rule gives from the reference source’s mean, and
4.5 holds both margins to 6 dB, but a short margin of the reference source is
no upper bound. enters Eq. 14 with a plus sign, so its
fixed 1,3 dB pulls the level down, and 8.1.3 gives the upper-bound reading to
the margin of the source under test alone. The library flags both bands with
background_requirement_met and only the first with upper_bound. The
sound power level in each octave band is then
and the Annex B total with the octave corrections of Table B.1.
st = survey[:5] # five positions: one on each side of the box, one above it (7.3)rss = np.array([ # the reference source where the blender stood, same positions [87.8, 83.9, 86.8, 87.9, 87.1, 85.2, 81.8], [87.1, 83.1, 86.1, 87.3, 86.6, 84.7, 81.2], [88.5, 84.4, 87.2, 88.4, 87.6, 85.8, 82.4], [87.7, 83.6, 86.5, 87.8, 87.0, 85.1, 81.6], [88.2, 83.8, 86.9, 88.1, 87.4, 85.4, 82.0],])lw_rss = np.array([94.0, 89.9, 92.8, 94.1, 93.2, 91.3, 87.9]) # calibratedbackground = np.array([ # a ventilation duct in the ceiling, loud at the low end [78.5, 71.0, 64.0, 58.0, 52.0, 45.0, 40.0], [79.5, 71.5, 64.5, 58.5, 52.5, 45.5, 40.5], [78.0, 70.5, 63.5, 57.5, 51.5, 44.5, 39.5], [79.0, 71.0, 64.0, 58.0, 52.0, 45.0, 40.0], [79.5, 71.5, 64.5, 58.5, 52.5, 45.5, 40.5], # above the box, nearer the duct])res = emission.sound_power_hard_walled( st, rss, lw_rss, freqs, background_levels=background, sigma_omc_db=1.0,)print(np.round(res.sound_power_level, 1)) # [89.1 92.2 94.3 96.3 93.7 89.6 84.2]print(round(res.sound_power_level_a, 1)) # 100.1 dB(A)print(np.round(res.background_correction, 2)) # [1.3 0.14 0. 0. 0. 0. 0. ]print(np.round(res.background_correction_ref, 2)) # [0.59 0.24 0. 0. 0. 0. 0. ]print(res.background_requirement_met) # [False True True True True True True]print(res.upper_bound) # [ True False False False False False False]print(round(res.expanded_uncertainty_a, 1)) # 3.6 dB (k = 2)At 125 Hz the duct comes within 4.7 dB of the blender, so takes its
fixed 1,3 dB where Eq. 13 would take 1.8 dB, the call warns, and the 89.1 dB
the band reports is an upper bound, which is what the False and the
True of upper_bound say. The louder reference source keeps 8.9 dB over
the duct there, inside the Eq. 13 range, so its 0.59 dB is exact. Had it been
the reference source that fell short, the band would fail 4.5 all the same,
but upper_bound would stay False: its capped correction would read low.
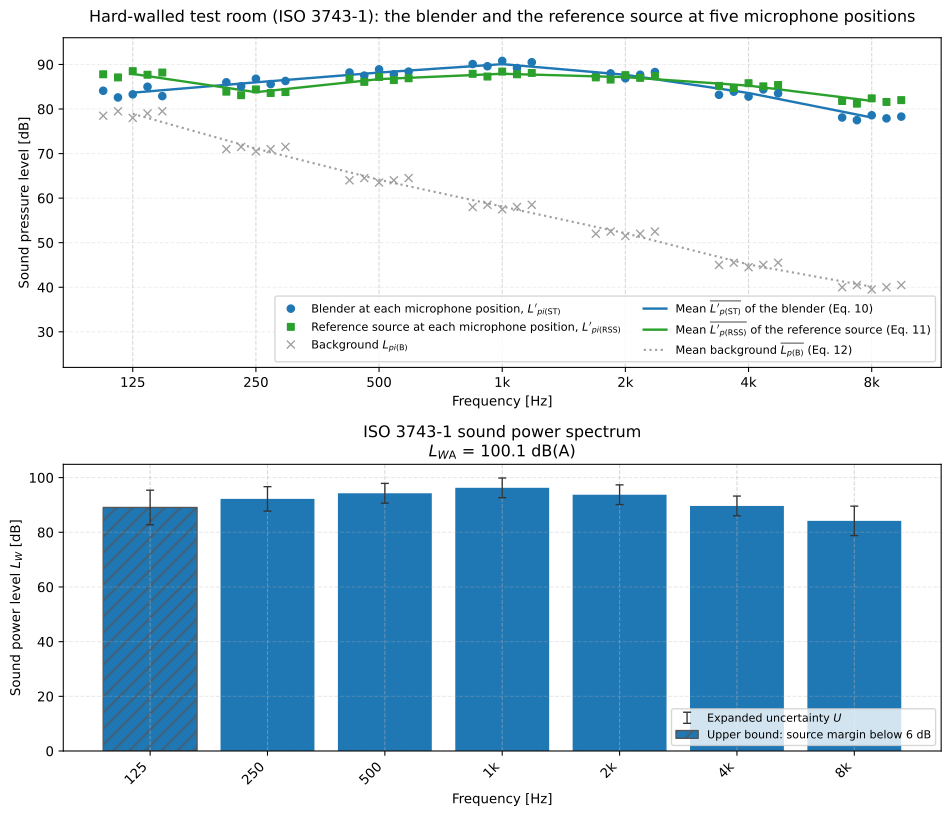
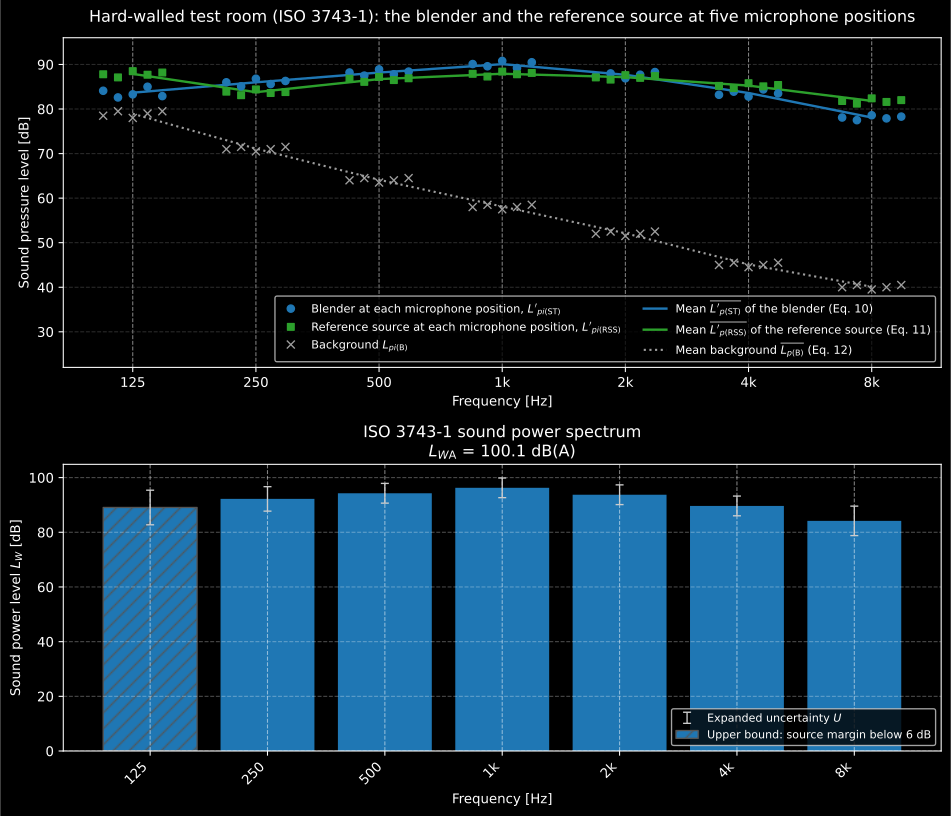
The comparison in a hard-walled room. Above, the blender and the reference source at the five microphone positions, with the background that decides ; below, Eq. 14 band by band, the 125 Hz upper bound hatched and the expanded uncertainty of Table 3 with = 1.0 dB on every bar.
Show the code for this figure
import matplotlib.pyplot as plt
# res is the HardWalledSoundPowerResult computed above. One line:res.plot()   # LW bars, LWA in the title, the upper bound hatched, U as error barsplt.show()
# By hand: both sources and the background per position above, Eq. 14 below.x = np.arange(freqs.size)fig, (axt, axb) = plt.subplots(2, 1, figsize=(10, 8.6))for i, offset in enumerate(np.linspace(-0.24, 0.24, st.shape[0])):    axt.plot(x + offset, st[i], "o", color="#1f77b4")    axt.plot(x + offset, rss[i], "s", color="#2ca02c")    axt.plot(x + offset, background[i], "x", color="#9e9e9e")axt.plot(x, res.mean_source_level, "-", color="#1f77b4", label="mean, blender")axt.plot(x, res.mean_reference_level, "-", color="#2ca02c", label="mean, reference source")axt.plot(x, res.mean_background_level, ":", color="#9e9e9e", label="mean background")axt.set_xticks(x, [f"{f:g}" for f in freqs])axt.set_ylabel("Sound pressure level [dB]")axt.legend()res.plot(ax=axb)plt.show()
sound_power_hard_walled() parameters
Section titled “sound_power_hard_walled() parameters”| Parameter | Type | Units | Range / default | Notes |
|---|---|---|---|---|
levels | 1D, 2D or 3D array | dB | (bands,), (NM, bands) or (NS, NM, bands) | Measured : one traverse (NOTE to 8.1.2), one row per fixed position (at least three, 7.3), or one grid per source location (Eq. 9) |
levels_ref | 1D or 2D array | dB | (bands,) or (NM, bands) | The reference source at the same positions, or on the same traverse |
lw_ref | 1D array or ReferenceSourceCalibration | dB | (bands,) | Calibrated at the conditions of the test; a ReferenceSourceCalibration is summed from its one-third octave bands into the octaves at frequencies and read there, less its own |
frequencies | 1D array | Hz | 125 Hz to 8 kHz octaves | Ascending octave centres (3.11); 63 Hz is accepted where the room and the instrumentation are satisfactory there (Table B.1 footnote) |
background_levels | 1D or 2D array | dB | (bands,) or (NM, bands) | , averaged by Eq. 12. None warns and leaves background_requirement_met False throughout |
background_levels_ref | 1D or 2D array | dB | same shapes | Background for the reference-source reading; None reuses background_levels |
temperature_c | float | °C | default 23.0 | For (Annex A) |
static_pressure_kpa | float | kPa | default 101.325 | For ; static_pressure_from_altitude gives it from the altitude (Eq. A.2) |
sigma_omc_db | float | dB | Operating and mounting conditions (9.2); None leaves the uncertainty NaN | |
coverage_factor | float | default 2.0 | of Eq. 23, which 9.5 fixes at 2; 1,6 for a one-sided comparison with a limit |
The function returns a HardWalledSoundPowerResult: sound_power_level
(Eq. 14), mean_source_level, mean_reference_level and
mean_background_level (Eq. 10 to 12), reference_power_level,
background_correction and background_correction_ref per band,
background_requirement_met, upper_bound, c2, sigma_r0 per band (Table 3) and
sigma_r0_a, sigma_omc, coverage_factor, sound_power_level_a,
microphone_positions and source_positions; the properties sigma_tot,
expanded_uncertainty (and their _a forms) and sound_power_level_ref
complete it.
Bursts: the sound energy level (Eq. 15 to 20)
Section titled “Bursts: the sound energy level (Eq. 15 to 20)”A stapler, a door latch or a paper punch has no steady power. Clause 7.6
measures its single event level at each position, at least five events one
at a time or once over a run of events, and 8.2 reduces them to
the level of one event (Eq. 15 or 16), averages them over the source
locations and positions (Eq. 17, 18), corrects them by the same rule
(Eq. 19) and returns the sound energy level in dB re 1 pJ by
Eq. 20, the Eq. 14 comparison with in place
of . Eq. 19 subtracts the time-averaged
background from a time-integrated event level, as ISO 3744 does; the
library compares the background as its exposure over the same interval ,
, and so needs
integration_time_s with a background (see the
errata).
# An electric desk stapler in the same room: five strokes measured one at a# time at the same five positions, each over T = 2 s.strokes = st + 12.0events = np.stack([strokes + d for d in (-0.4, 0.1, 0.3, -0.2, 0.2)])energy = emission.sound_energy_hard_walled( events, rss, lw_rss, freqs, # (5 events, 5 positions, 7 bands) background_levels=background, integration_time_s=2.0, sigma_omc_db=2.0,)print(np.round(energy.sound_energy_level, 1)) # [102.2 104.4 106.3 108.3 105.7 101.6 96.2]print(round(energy.sound_energy_level_a, 1)) # 112.1 dB(A) re 1 pJprint(round(energy.expanded_uncertainty_a, 1)) # 5.0 dB: the 9.5 EXAMPLEThe 5.0 dB is the example of clause 9.5, reproduced because the inputs are the same: = 1,5 dB from Table 3, = 2,0 dB and = 2.
How the measurement goes
Section titled “How the measurement goes”Qualify the room first: its volume against the reference box, its surfaces against 0,20, and the eight orientations of a directional source against Table 3; a source of the type to be tested may stand in for the directional one, but the room is then qualified for that type only. Use class 1 instruments and filters and a class 1 calibrator before and after each series, discarding the series if the two readings differ by more than 0,5 dB (5.2). Set the source as it is used, at least 1 m from every wall and the ceiling, the sides of its box not parallel to the walls (6.3), and turn a directional source so that its strongest component reaches every microphone by reflection. Survey six positions if it has tones, and use the number of source locations Table 2 gives. Place at least three microphones, from the source, 0,5 m from the walls and the ceiling and half a wavelength of the lowest band apart; five, one on each side of the box and one above it, where the room allows (7.3). Read the source, the reference source where it stood for about 30 s, and the background over the same interval, and report the band and A-weighted levels to 0,1 dB with the expanded uncertainty.
2. The special reverberation room (ISO 3743-2)
Section titled “2. The special reverberation room (ISO 3743-2)”The room. At least 70 m³, and at most 300 m³ when the 4 kHz and 8 kHz octaves are measured by the direct method (6.2 and its NOTE). Its reverberation time is prescribed band by band: between and (0,8 and 1,2 above 6,3 kHz), with
or, for a room that is not nearly cubical, (NOTE to 6.3),
and a nominal reverberation time between 0,5 s and 1,0 s.
The NOTE form of is the argument of the Waterhouse term of ISO 3741:
where ISO 3741 corrects for the energy gathered near the walls, this room
builds it in, with a reverberation time that rises at low frequencies and
the 13 dB of Formula 9 in place of 14 dB (NOTE to 10.2). The standard finds
by centring the measured values within the limiting curves
(6.3, B.5) and prints no rule for the centring; the library takes the
that leaves the most margin, the one that minimises the
largest deviation of any band from the ideal curve measured against that
band’s own tolerance. Where the curve is followed exactly, B.5 gives
Formula (B.2), for its 70 m³ room, 1,06
being at 1 000 Hz, and the library returns
for such a room at any volume. The EXAMPLE
of B.5 centres the measured curve of its Figure B.4 and reads
= 1,09 at 1 kHz, so = 0,8 s/1,09 = 0,73 s;
on the same curve the library’s rule gives 1.05 and 0.76 s, 0.17 dB apart in
the of Formula 9. The 1,09 is the midpoint of the extreme ratios taken
against 0,9 and 1,1 alone, and it puts the 250 Hz band of Figure B.4 at
1.13 , outside the limits the example says the curve is centred in, so the
library keeps its rule; a given in
nominal_reverberation_time_s, the printed 0,73 s among them, is checked as
given (see the errata). 6.6 then asks the climate to hold:
during the test within ±10 % of its value
while the reverberation time was measured. Clause 5 adds a recommendation on
the source: its volume should not exceed 1 % of the room’s, 0,7 m³ in a room
of 70 m³. Given source_volume_m3, the check reads it as
source_size_recommended and warns above it, but leaves passes to 6.2, 6.3
and 6.6, since the clause says “should”.
# A 4.8 m x 5.0 m x 3.0 m special reverberation room, 72 m3, measured in# one-third-octave bands at 52 % and 21 degC.thirds = np.array([ 100.0, 125.0, 160.0, 200.0, 250.0, 315.0, 400.0, 500.0, 630.0, 800.0, 1000.0, 1250.0, 1600.0, 2000.0, 2500.0, 3150.0, 4000.0, 5000.0, 6300.0, 8000.0, 10000.0,])t = np.array([ 1.30, 1.13, 1.14, 1.01, 0.99, 0.90, 0.94, 0.86, 0.87, 0.82, 0.83, 0.83, 0.79, 0.83, 0.79, 0.80, 0.77, 0.81, 0.74, 0.71, 0.67,])room2 = emission.check_special_room_reverberation( t, thirds, volume_m3=72.0, relative_humidity_percent=48.0, temperature_c=22.0, # during the test reverberation_relative_humidity_percent=52.0, reverberation_temperature_c=21.0,)print(round(room2.nominal_reverberation_time_s, 2)) # 0.77 s, centredprint(room2.passes) # Trueprint(round(room2.climate_product_change, 3)) # -0.041: within +/-10 % (6.6)print(np.round(emission.reverberation_parameter([100.0, 1000.0], 72.0), 3)) # [1.618 1.062]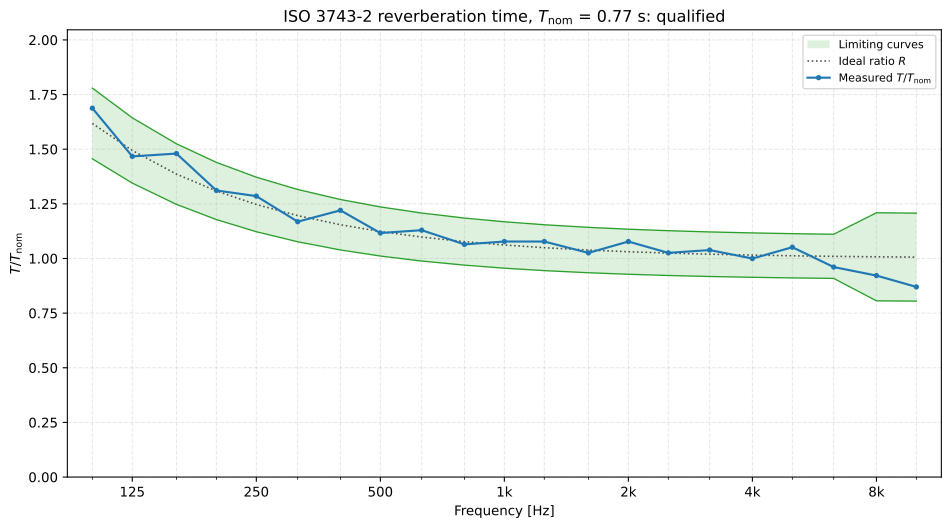
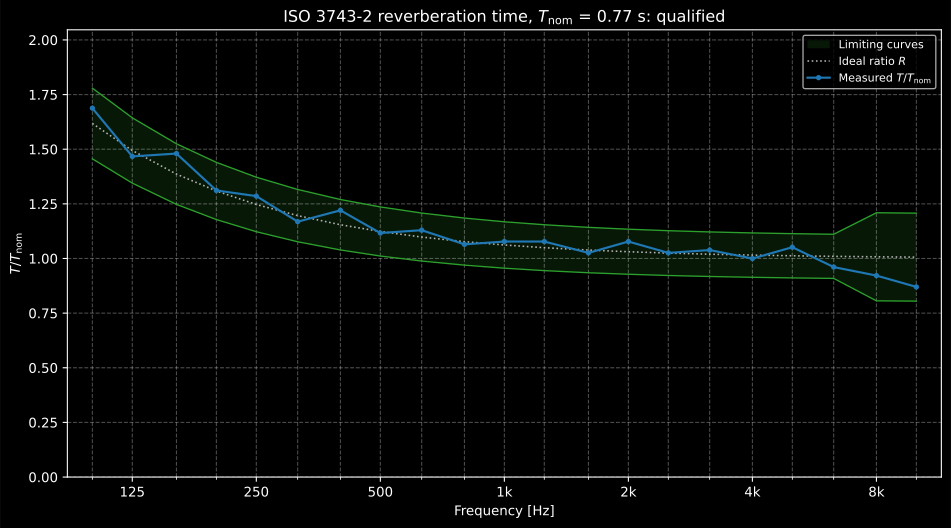
6.3 laid out as Figure B.3: the measured inside the limiting curves of this 72 m³ room, with the centred in the title. The curves widen above the 6,3 kHz band, as the text of 6.3 says; Figure B.3 draws them wide at 6,3 kHz already (see the errata).
Show the code for this figure
import matplotlib.pyplot as plt
room2.plot()   # T/Tnom, the limiting curves and the ideal Rplt.show()
The surfaces and the suitability evaluation. The floor reflects, its absorption coefficient below 0,06, and each wall and the ceiling absorbs within 0,5 and 1,5 times the mean of the walls and ceiling (6.4); the clause does not say how that mean is formed, and with the areas given the library weights by them. Before the room is used, 6.7 determines the octave-band power of a broadband reference source calibrated by ISO 3741, or by ISO 6926 and ISO 3745, in the room by this standard and compares it with the calibration: within ±5 dB at 125 Hz, ±3 dB from 250 Hz to 4 kHz and ±4 dB at 8 kHz (Table 1). A certificate holds its levels under the reference conditions, 23,0 °C and 101,325 kPa, and passed as levels they stand for the levels at the test: this first comparison takes the reference source’s run in the room at those conditions.
walls = np.array([  # 6.4: each wall and the ceiling, octave bands    [0.16, 0.14, 0.12, 0.11, 0.10, 0.10, 0.11],    [0.18, 0.15, 0.13, 0.12, 0.11, 0.11, 0.12],    [0.13, 0.12, 0.11, 0.10, 0.09, 0.09, 0.10],    [0.17, 0.15, 0.12, 0.11, 0.10, 0.10, 0.12],    [0.12, 0.11, 0.10, 0.09, 0.09, 0.09, 0.10],   # the ceiling])floor = np.array([0.02, 0.02, 0.02, 0.03, 0.03, 0.04, 0.05])surfaces = emission.check_special_room_surfaces(    walls, floor, freqs, surface_areas_m2=[15.0, 14.4, 15.0, 14.4, 24.0])print(surfaces.passes)                               # Trueprint(np.round(surfaces.surface_ratio.min(), 2), np.round(surfaces.surface_ratio.max(), 2))  # 0.81 1.21
tnom = round(room2.nominal_reverberation_time_s, 2)bg2 = np.array([48.0, 45.0, 42.0, 40.0, 38.0, 36.0, 35.0])lw_r = np.array([80.0, 83.5, 86.2, 86.9, 86.4, 84.3, 80.7])  # calibrated by ISO 3741rss2 = np.array([  # the reference source on the floor, 1.5 m from the walls    [74.5, 76.8, 79.8, 80.0, 80.2, 77.2, 73.7],    [73.6, 77.3, 79.3, 80.3, 79.7, 77.5, 73.3],    [74.3, 77.5, 79.7, 79.9, 80.0, 77.7, 73.8],    [73.8, 76.9, 79.5, 80.4, 79.6, 77.3, 73.7],    [74.2, 77.2, 79.9, 80.2, 80.1, 77.2, 73.4],    [74.1, 76.9, 79.4, 79.8, 79.8, 77.5, 73.6],])in_room = emission.sound_power_special_room(    rss2, freqs, volume_m3=72.0, nominal_reverberation_time_s=tnom, background_levels=bg2,)suitability = emission.check_special_room_suitability(in_room.sound_power_level, lw_r, freqs)print(np.round(suitability.difference_db, 1))   # [ 0.8  0.3  0.1 -0.1  0.2 -0.2 -0.4]print(suitability.passes)                       # True
The calibration itself, read at the test. Formula 9 gives the power the
source radiated under the meteorological conditions of the test (Annex E),
and an ISO 6926 calibration holds it under the reference conditions,
23,0 °C and 101,325 kPa. check_special_room_suitability takes the
ReferenceSourceCalibration in place of the levels, with the temperature and
the static pressure in the room during step 2, and reads it there, as the
comparison method of 10.3 does: each octave is the energy sum of its three
one-third octave bands, less the of the Annex A formula the
calibration used, which ISO 6926 8.4 asks the laboratory and the user to
share. Levels passed as such are taken as already carried to the test, and
the conditions then only have to be valid. The room’s levels to pass are
sound_power_level, the level at the test, and not sound_power_level_ref,
which Annex E has already carried to the reference conditions and which
would then count twice. Here the same room levels are read as a run at
22 °C and 97.5 kPa, against an ISO 6926 calibration of the same source made
in a hemi-anechoic room: the source radiates 0.16 dB less there than under
the reference conditions, so every difference is 0.16 dB larger than against
the certificate as printed.
# The same source calibrated by ISO 6926 in a hemi-anechoic room: 20 fixed# positions on the 2 m hemisphere, one-third octaves from 100 Hz to 10 kHz# (the levels are taken equal at every position, for brevity).hemisphere = np.tile(np.repeat(lw_r, 3) - 10.0 * np.log10(3.0 * 2.0 * np.pi * 2.0**2), (20, 1))calibration = emission.reference_source_calibration( hemisphere, frequencies_hz=thirds, arrangement="fixed",)print(np.round(calibration.sound_power_level_at(freqs, bandwidth="octave"), 2))# [79.87 83.37 86.07 86.77 86.27 84.17 80.57] dB under the reference conditionssuitability2 = emission.check_special_room_suitability( in_room.sound_power_level, calibration, freqs, temperature_c=22.0, static_pressure_kpa=97.5,)print(np.round(suitability2.calibrated_power_level_db, 2)) # [79.72 83.22 85.92 86.62 86.12 84.02 80.42]print(np.round(suitability2.difference_db, 1)) # [ 1.1 0.6 0.4 0.2 0.5 0.1 -0.1]print(suitability2.passes) # TrueThe certificate’s octaves sit 0.13 dB below the levels the hemisphere was built from: that is , the reference-quantity correction of ISO 6926 Formula (2), −0.13 dB at the reference conditions.
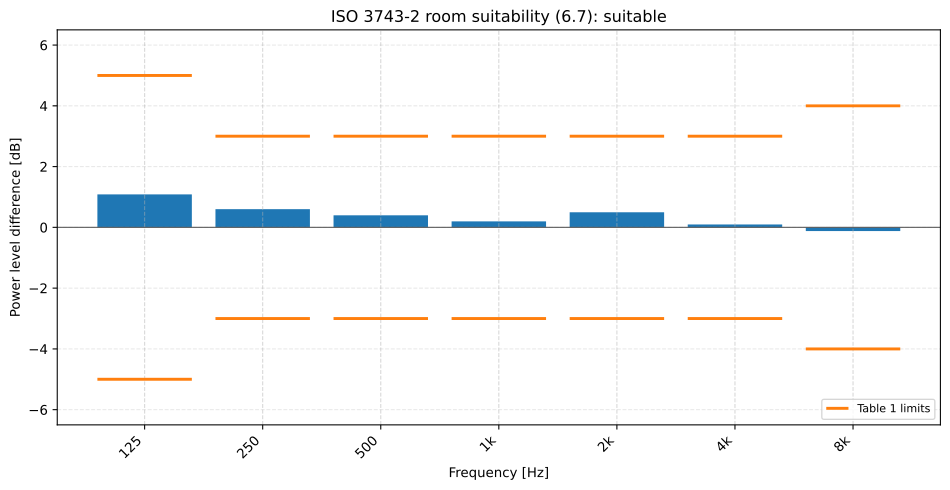
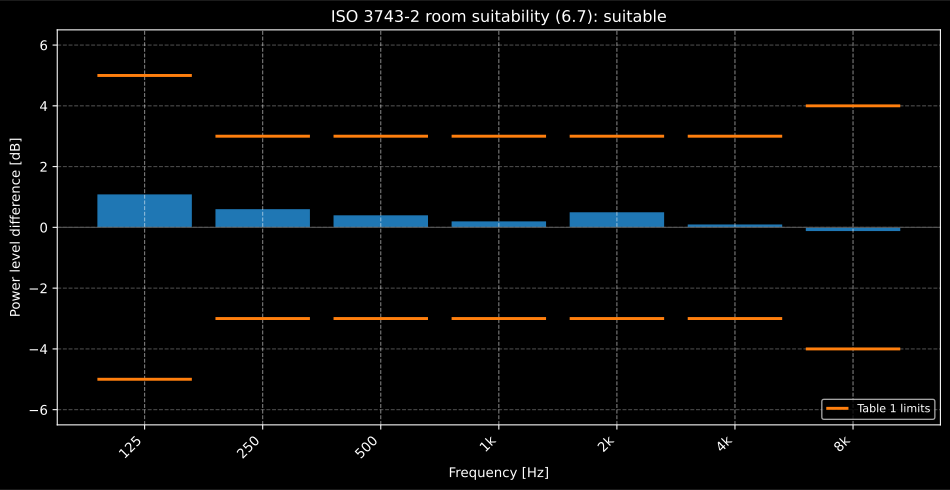
6.7 against the ISO 6926 calibration read at 22 °C and 97.5 kPa: the difference per octave band within the ± limits of Table 1.
Show the code for this figure
import matplotlib.pyplot as plt
suitability2.plot()   # the difference per band within the Table 1 limitsplt.show()
The survey. Six positions at one source location give per band and for the A-weighted level (Formula 4), about the arithmetic mean when the six levels span no more than 5 dB and about their energy mean (Formula 5) when they span more. Table 3 turns it into the minimum number of source locations for 3, 6 or 12 microphone positions, and 9.5 reads the same classes as the spectrum: broadband below 2,3 dB, narrow-band components up to 4 dB, a discrete tone above, which the report must mention.
# A desktop printer whose cooling fan hums in the 500 Hz octave:# the survey of 9.4, six positions at one source location, and A-weighted.survey2 = np.array([ [62.1, 65.4, 63.2, 64.2, 61.5, 58.1, 52.3], [60.4, 66.2, 69.1, 64.9, 61.1, 57.7, 51.8], [63.0, 64.1, 64.0, 63.8, 62.0, 58.6, 52.9], [61.2, 66.8, 68.7, 64.6, 61.7, 57.9, 52.1], [62.6, 64.7, 62.9, 63.5, 61.3, 58.4, 52.6], [60.9, 65.9, 67.8, 64.1, 61.9, 58.0, 52.0],])survey2_a = np.array([68.4, 70.1, 68.5, 70.0, 68.1, 69.5])plan2 = emission.special_room_source_locations(survey2, freqs, a_weighted_levels=survey2_a)print(np.round(plan2.standard_deviation_db, 2)) # [1.02 0.99 3. 0.51 0.35 0.33 0.41]print(plan2.spectral_character[2]) # narrow-bandprint(plan2.source_locations, plan2.a_weighted_source_locations) # [1 1 2 1 1 1 1] 1The direct and the comparison methods. Every level is corrected for background by the stepped Table 4 at its own position (9.8): 2 dB at a 4 dB or 5 dB margin, 1 dB from 6 dB to 8 dB, 0,5 dB at 9 dB and 10 dB, nothing above; the table gives whole decibels and the library reads a margin at the nearest one. The corrected levels of every position and source location are energy-averaged (Formula 8), and the direct method reads the power off the room (10.2):
in each octave band and, from the A-weighted levels, for the A-weighted level directly, which is how clause 4 describes the method. The comparison method keeps a reference source at no fewer than six positions (10.3) and reads (Formula 10), with the A-weighted level from the bands by Annex F.
# So two source locations, the second 1.2 m further along the floor.second = survey2 + np.array([    [0.3, -0.4, 2.1, 0.2, -0.1, 0.2, 0.1],    [-0.2, 0.3, -3.8, -0.1, 0.2, -0.1, 0.0],    [0.1, 0.2, 3.3, 0.1, 0.0, 0.1, -0.1],    [-0.3, -0.2, -3.1, 0.2, 0.1, 0.0, 0.2],    [0.2, 0.1, 2.9, -0.2, -0.2, 0.1, 0.1],    [-0.1, 0.0, -2.4, 0.0, 0.1, -0.2, 0.0],])levels = np.stack([survey2, second])                           # (2, 6, 7)levels_a = np.array([survey2_a, [68.8, 69.0, 69.4, 69.2, 68.5, 68.9]])direct = emission.sound_power_special_room(    levels, freqs, volume_m3=72.0, nominal_reverberation_time_s=tnom,    background_levels=bg2, a_weighted_levels=levels_a, a_weighted_background_levels=46.0,    sigma_omc_db=0.5,)print(np.round(direct.sound_power_level, 1))     # [68.5 72.3 73.  70.9 68.3 64.8 59. ]print(round(direct.sound_power_level_a_direct, 1), round(direct.sound_power_level_a, 1))  # 75.8 75.8print(round(direct.expanded_uncertainty_a, 1))   # 4.1 dB (Table 5, k = 2)
comparison = emission.sound_power_special_room_comparison(    levels, rss2, lw_r, freqs, background_levels=bg2, sigma_omc_db=0.5,)print(np.round(comparison.sound_power_level, 1))  # [67.7 72.  72.9 71.  68.1 65.  59.4]print(round(comparison.sound_power_level_a, 1))   # 75.7 dB(A)print(emission.special_room_background_correction([62.0, 62.0, 62.0], [57.6, 54.5, 50.0]))  # [2. 1. 0.]
The two methods part by the room’s own deviation from its model, the same 0.8 dB at 125 Hz that the suitability evaluation found: the direct method reads the room, the comparison method cancels it.
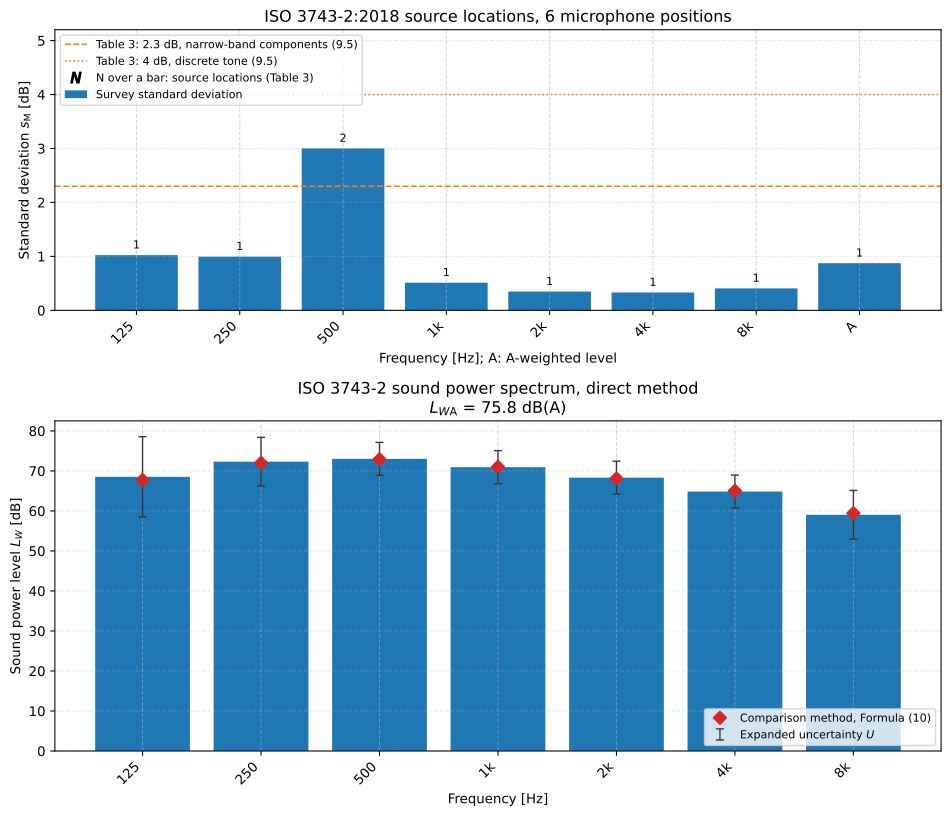
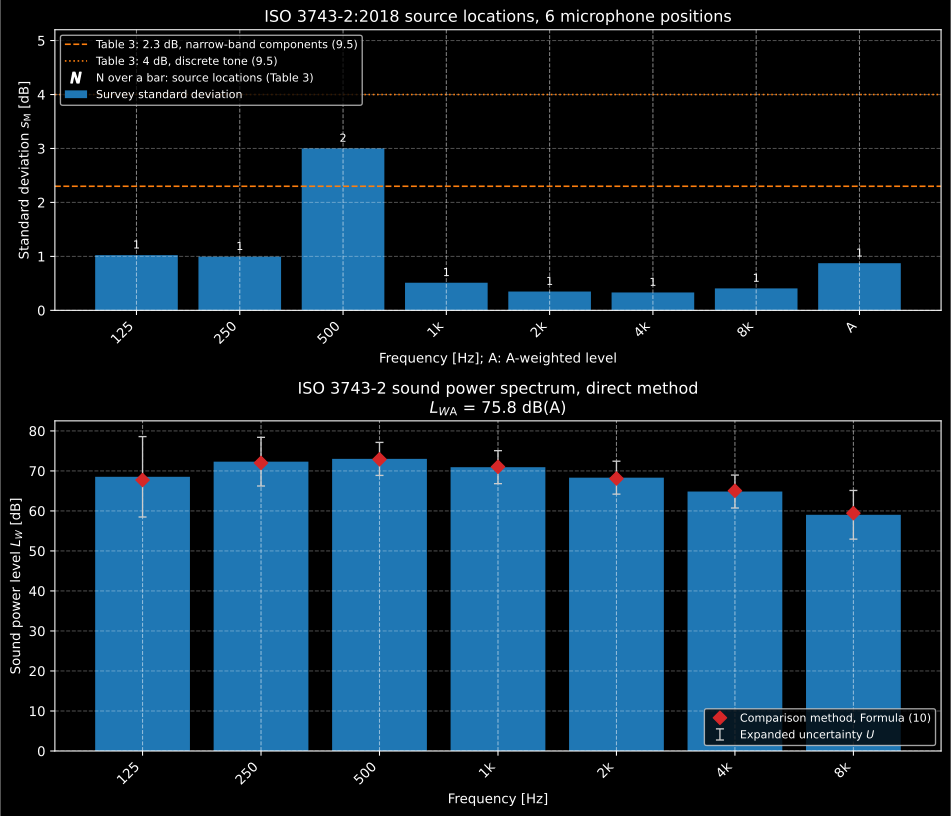
9.4 and 10 in one view. Above, the survey’s against the class limits of Table 3, the fan hum at 500 Hz asking for two source locations; below, Formula 9 band by band with the Table 5 expanded uncertainty, and Formula 10 as diamonds.
Show the code for this figure
import matplotlib.pyplot as plt
fig, (axt, axb) = plt.subplots(2, 1, figsize=(10, 8.6), height_ratios=(0.85, 1.0))plan2.plot(ax=axt)direct.plot(ax=axb)axb.plot(np.arange(freqs.size), comparison.sound_power_level, "D",         color="#d62728", label="Comparison method, Formula (10)")axb.legend(loc="lower right")plt.show()
sound_power_special_room() parameters
Section titled “sound_power_special_room() parameters”| Parameter | Type | Units | Range / default | Notes |
|---|---|---|---|---|
levels | 1D, 2D or 3D array | dB | (bands,), (NM, bands) or (NS, NM, bands) | Measured band levels: one traverse, one row per position, or one grid per source location; every entry enters Formula 8 |
frequencies | 1D array | Hz | 125 Hz to 8 kHz octaves | Ascending octave centres of Table F.1; 63 Hz under its footnote |
volume_m3 | float | m³ | Warns below 70 m³, and above 300 m³ when the bands reach the 8 kHz octave (6.2) | |
nominal_reverberation_time_s | float | s | ; warns outside 0,5 s to 1,0 s (6.3) | |
background_levels | 1D or 2D array | dB | (bands,) or (NM, bands) | Table 4 at each position; None warns and meets nothing |
a_weighted_levels | 0D, 1D or 2D array | dB | one per position | The A-weighted levels for Formula 9 directly; None leaves sound_power_level_a_direct NaN |
a_weighted_background_levels | float or 1D array | dB | one, or one per position | Their background, Table 4 |
temperature_c, static_pressure_kpa | float | °C, kPa | 23.0, 101.325 | For (Annex E) |
sigma_omc_db, coverage_factor | float | dB, | None, 2.0 | Formulae 12 and 13 |
sound_power_special_room_comparison() takes levels, levels_ref (at
least six positions, 10.3), lw_ref (the levels or a
ReferenceSourceCalibration, as in Part 1), frequencies,
background_levels, background_levels_ref and the same four last
arguments. Both return a
SpecialRoomSoundPowerResult: sound_power_level, mean_pressure_level,
background_correction, background_requirement_met, the reference
source’s mean_reference_level and reference_power_level (comparison) or
the room’s volume_m3 and nominal_reverberation_time_s (direct), c2,
sigma_r0 (Table 5), sound_power_level_a (Annex F),
sound_power_level_a_direct and mean_a_weighted_level, with the same
uncertainty properties as Part 1.
How the measurement goes
Section titled “How the measurement goes”Build or treat the room to the curve: membrane absorbers for the low end and perforated panels filled with mineral wool for the middle and high frequencies, spread at random over the walls and the ceiling in patches of no more than 1,5 m², and a floor of painted poured concrete (Annex B). Measure the reverberation time in one-third-octave bands with any absorbing support of the source in place, centre it, and keep the humidity and temperature of that measurement within 6.6 during every test. Check the room once with a calibrated reference source (6.7), noting the temperature and the static pressure in the room while it runs, the conditions at which its calibration is read. Use a microphone flat for random incidence, within the tolerances of Table 2 of the standard. Set the source as it is used or, failing that, on the floor at least 1 m from the nearest wall (8.2), and keep it within 1 % of the room’s volume (clause 5). Survey six positions, at least from the room’s surfaces for the lowest band, from the source and apart ( = 3,5 m for A-weighting, 9.3), and take the positions and locations Table 3 gives. Average at least 10 s per band with a moving microphone, 30 s at 160 Hz and below and for A-weighting (9.2).
3. Uncertainty, round robins and reference conditions
Section titled “3. Uncertainty, round robins and reference conditions”Uncertainty (ISO 3743-1 clause 9, ISO 3743-2 clause 11). and , with the typical upper bound per band: Table 3 of Part 1 gives 3,0 / 2,0 / 1,5 / 2,5 dB at 125 Hz / 250 Hz / 500 Hz to 4 kHz / 8 kHz and 1,5 dB A-weighted, Table 5 of Part 2 gives 5,0 / 3,0 / 2,0 / 3,0 dB and 2,0 dB. The two EXAMPLEs, with = 2,0 dB and = 2, give 5 dB (Part 1) and 5,7 dB (Part 2), and Tables C.1 and D.1 print the totals for three stabilities of the operating conditions; the conformance report pins all of them. The budgets of Annexes C and D are informative and not modelled.
Round robins (Eq. 24 of Part 1). A round robin gives the total standard deviation of one source, which still carries that source’s instability; takes it out, and should not be used with above . Part 2 prints the same relation as its Formula (14) with a plus sign, which its own next paragraph contradicts; the library takes the difference for both (see the errata).
Reference conditions (Annex A of Part 1, Annex E of Part 2). Above 500 m the levels are carried to 101,325 kPa and 23,0 °C by , the of ISO 3741 and ISO 3747, with the static pressure from the altitude by . Both annexes print alone.
# A laboratory 1 100 m above sea level, at 19 degC.ps = emission.static_pressure_from_altitude(1100.0)high = emission.sound_power_hard_walled( st, rss, lw_rss, freqs, background_levels=background, temperature_c=19.0, static_pressure_kpa=ps,)print(round(ps, 2), round(high.c2, 3)) # 88.79 kPa, 0.488 dB (Eq. A.2, A.1)print(round(high.sound_power_level_a_ref, 1)) # 100.6 dB(A) under the reference conditionsprint(round(emission.reproducibility_from_round_robin(1.9, 1.1), 2)) # 1.55 dB (Eq. 24)A-weighted totals (Annex B of Part 1, Annex F of Part 2). is the energy sum of the band levels plus the octave corrections of Table B.1 (the same as Table F.1 and as ISO 3744 Table E.2): −26,2, −16,1, −8,6, −3,2, 0,0, 1,2, 1,0 and −1,1 dB from 63 Hz to 8 kHz.
4. The test sheet (.report())
Section titled “4. The test sheet (.report())”A determination ends as a document. Both results have a .report() method
that writes a one-page PDF fiche in the layout of the other sound power
sheets: the method and its accuracy grade, an optional ReportMetadata
header (client, noise source, test room, instrumentation, climate, date), a
table per octave band, the spectrum, the boxed A-weighted level with the
expanded uncertainty and its coverage factor, and the chain of formulae the
level rests on, which is what clause 10.5 of Part 1 and 12.5 of Part 2 ask
the record to hold. The ISO 3743-1 table carries both sources: the mean
level of the source, the mean level and the calibrated power of the
reference sound source, and (or for a burst). The ISO 3743-2
table carries the mean level and , with the reference source’s columns
for the comparison method, and prints to the nearest one-half decibel
as its 12.5 d) asks, where Part 1 asks for 0,1 dB (10.5 g). In the ISO 3743-1 table
a band that 8.1.3 makes an upper bound is marked * and named one beneath
the table; a band that fails 4.5 through the reference source’s margin, or
with no background measured, is marked † and named as that. The ISO 3743-2
table marks * every band whose background requirement is not shown to be
met, which is all 9.8 says of it. The basis line states what the coverage
factor gives: 95 % two-sided for = 2, 95 % one-sided for a comparison
with a limit for = 1,6. The direct method boxes the
A-weighted level clause 4 describes, Formula 9 on the A-weighted sound
pressure levels, and prints the Annex F band total beside it. requirement
adds a PASS or FAIL verdict against a declared A-weighted limit,
verbose=True adds the background columns and language="es" writes the
Spanish sheet.
from phonometry import ReportMetadata
res.report(    "blender_iso3743_1.pdf",    metadata=ReportMetadata(        client="Example appliance manufacturer",        specimen="Bench-top blender on a test table, full speed",        test_room="Hard-walled test room, V = 60 m3, painted concrete",        requirement=102.0,    ),)   # LWA = 100.1 dB(A) re 1 pW, 125 Hz marked *: declared limit 102 dB(A), PASSdirect.report("printer_iso3743_2.pdf", language="es", verbose=True)
The example fiches are regenerated with make reports and kept rendered in
the repository; click a preview to open the PDF.
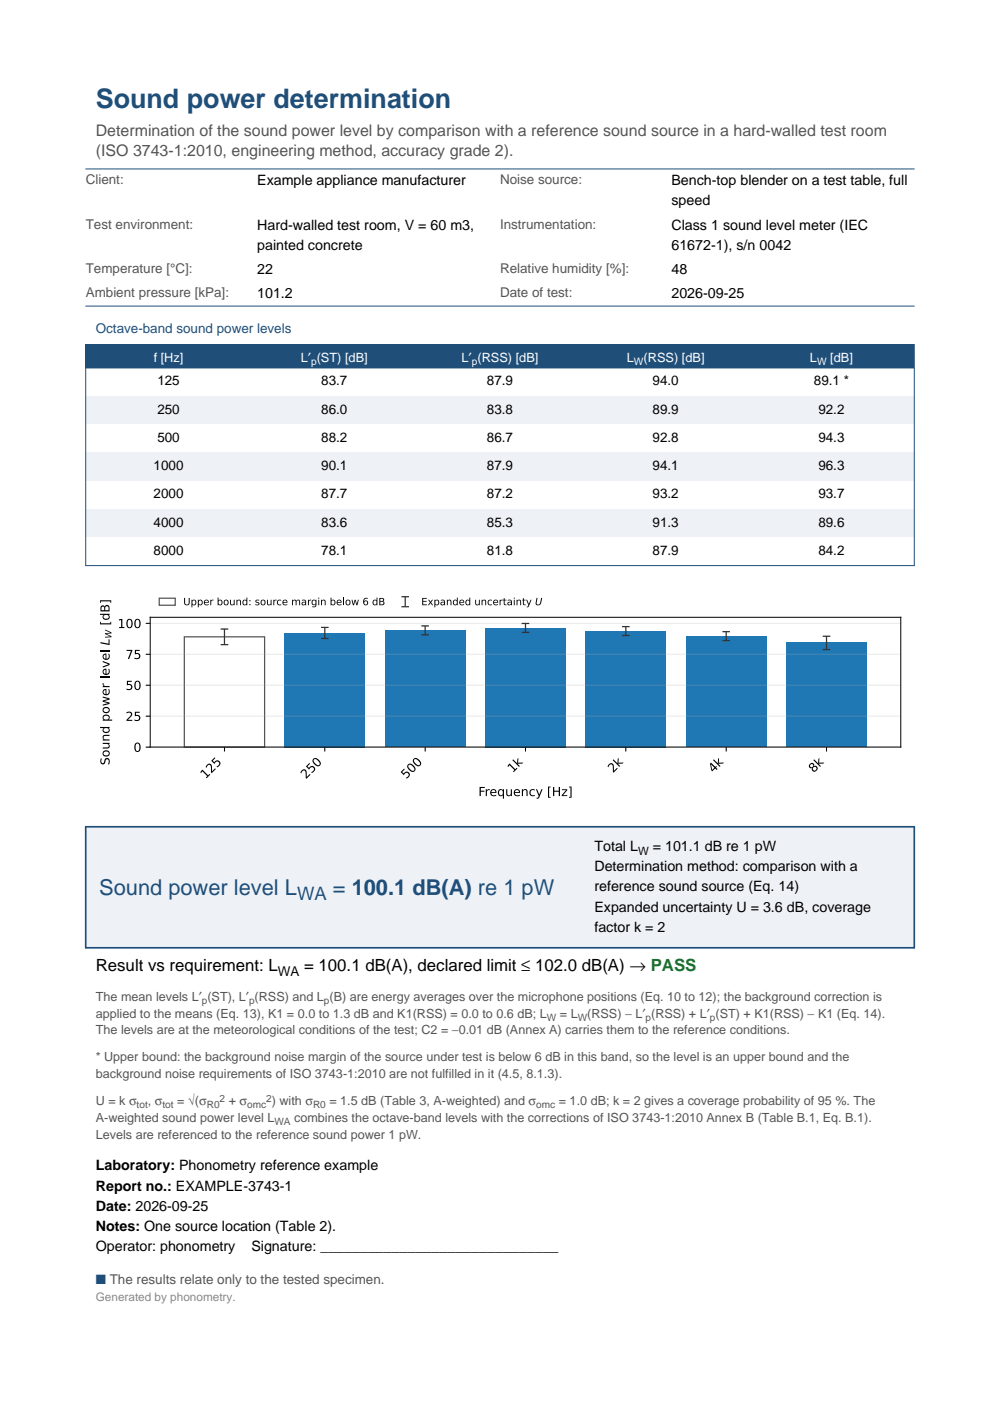
One-page ISO 3743-1 sound power determination fiche: a header with the client, the bench-top blender as noise source, the 60 cubic metre hard-walled test room, the instrumentation and the climate, the octave-band table from 125 Hz to 8 kHz of the mean level of the source, the mean level and the calibrated sound power level of the reference sound source and the determined LW, with the 125 Hz value of 89.1 dB marked by an asterisk, the sound power spectrum with its expanded uncertainty and the 125 Hz upper bound in the legend, the boxed A-weighted sound power level LWA = 100.1 dB(A) re 1 pW with the total LW, the comparison method and an expanded uncertainty of 3.6 dB at coverage factor 2, a PASS verdict against a declared 102 dB(A), and basis lines giving the Eq. 10 to 14 chain with its background corrections, the sentence naming the starred band an upper bound, the uncertainty from Table 3 and the Annex B A-weighting.
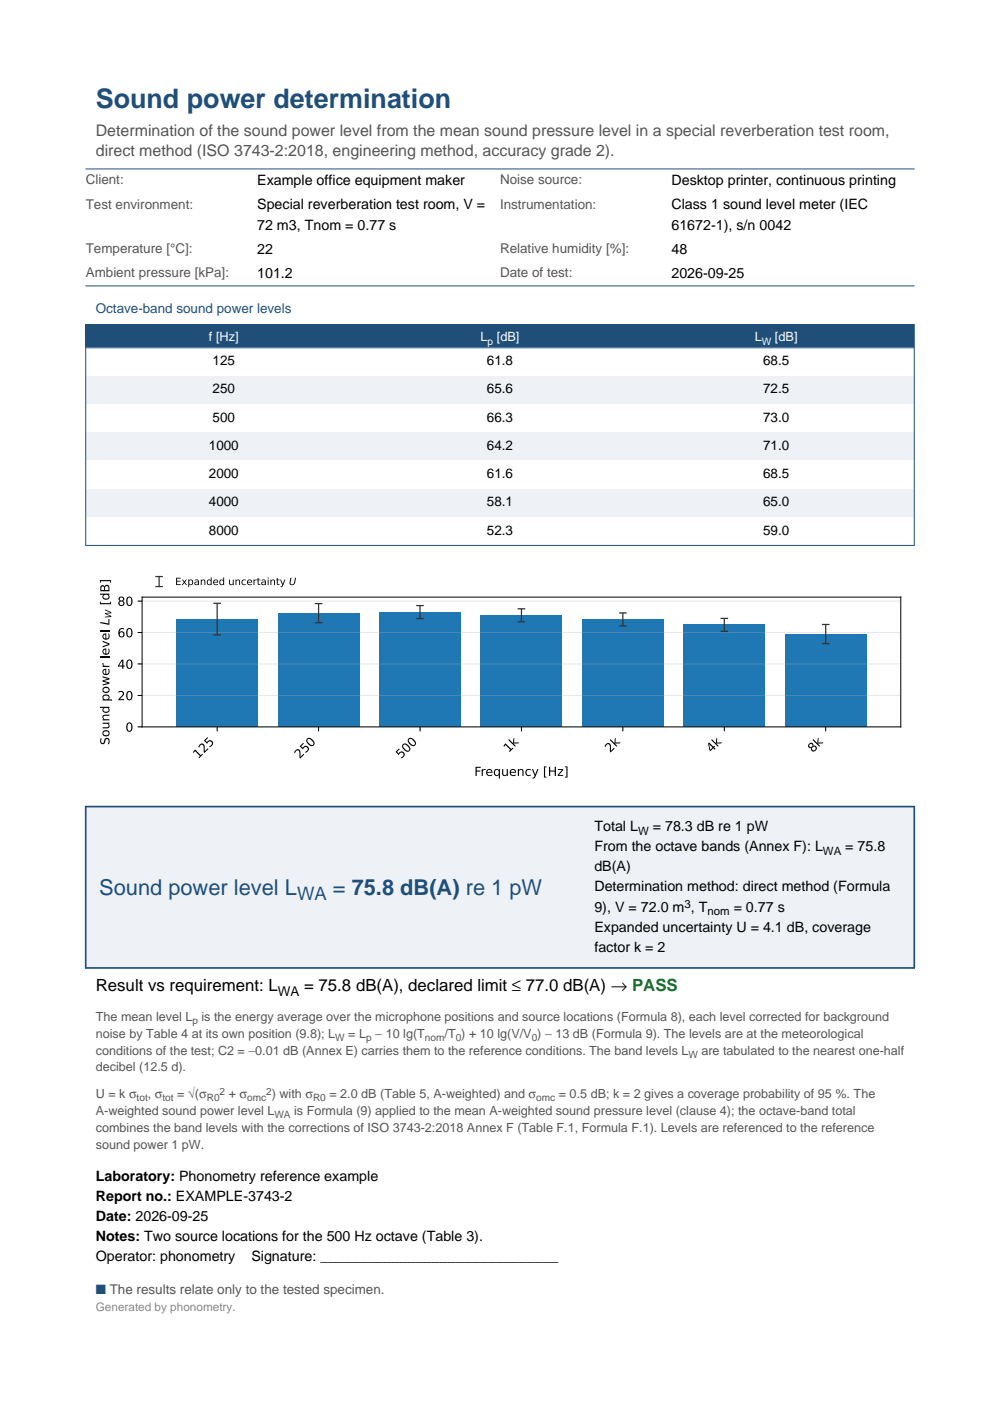
One-page ISO 3743-2 sound power determination fiche: a header with the client, the desktop printer as noise source, the 72 cubic metre special reverberation test room with a nominal reverberation time of 0.77 s, the instrumentation and the climate, the octave-band table from 125 Hz to 8 kHz of the mean sound pressure level and the determined LW to the nearest half decibel, the sound power spectrum with its expanded uncertainty, the boxed A-weighted sound power level LWA = 75.8 dB(A) re 1 pW from the A-weighted levels by Formula 9, with the total LW, the Annex F band total of 75.8 dB(A), the direct method with the room volume and nominal reverberation time and an expanded uncertainty of 4.1 dB at coverage factor 2, a PASS verdict against a declared 77 dB(A), and basis lines giving Formula 8 with the Table 4 background corrections and Formula 9, the uncertainty from Table 5 and the Annex F A-weighting.
What this guide covers
Section titled “What this guide covers”Covered
ISO 3743-1:2010: the room criteria of 4.2 to 4.4 (
check_hard_walled_room), the survey of 7.4 with Table 2 (hard_walled_source_locations), the means of Eq. 9 to 12, the background correction of 8.1.3 on the means with its 6 dB, 15 dB and 1,3 dB rules, the sound power level of Eq. 14 (sound_power_hard_walled), the sound energy level of Eq. 15 to 20 (sound_energy_hard_walled), the Table 3 reproducibility with Eq. 22 and 23, the round robin of Eq. 24 (reproducibility_from_round_robin), Annex A and the Annex B totals. ISO 3743-2:2018: the reverberation parameter of Formula (1) and its NOTE (reverberation_parameter), the limiting curves of 6.3 with a centred or given , the volume of 6.2, the climate of 6.6 and the source size of clause 5 (check_special_room_reverberation), the surfaces of 6.4 (check_special_room_surfaces), the suitability evaluation of 6.7 against the calibrated levels or an ISO 6926 calibration read at the conditions of the test (check_special_room_suitability), the survey of 9.4 with Table 3 and the spectral character of 9.5 (special_room_source_locations), Table 4 (special_room_background_correction), the direct Formula 9 (sound_power_special_room) and the comparison Formula 10 (sound_power_special_room_comparison), the Table 5 reproducibility, Annex E and the Annex F totals. Both results write the one-page test sheet through.report(), with the upper bounds of Part 1 and the other bands that fail the background requirement marked and stated apart.Not covered
The uncertainty budgets of Annex C (Part 1) and Annex D (Part 2) are informative and not modelled: is the typical upper bound of Table 3 or Table 5, not a value from a round robin or a model. The placement rules (source location, microphone distances from the source and the surfaces, traverse paths and their speed) are the operator’s decisions, made before the levels exist, and the instrumentation tolerances of Table 2 of Part 2 are the instrument’s. The design guidance of Annex B of Part 2 (the room proportions of Table B.1, the membrane absorber of Formula B.1) is advice for building a room, not a criterion the room is judged by. Part 2 leaves isolated bursts to ISO 3744 and ISO 3745 by its scope; Part 1 gives them a sound energy level. The reference sound source is taken as calibrated: its characteristics and calibration tolerances, Annex A of Part 2 (A.1 and Table A.1: ±1 dB from 100 Hz to 160 Hz, ±0,5 dB from 200 Hz to 4 kHz, ±1 dB from 5 kHz to 10 kHz) and ISO 6926 for Part 1, are its calibration certificate’s and are not judged here. An ISO 6926 calibration made in Free Field and Reference Sources, which judges the requirements of ISO 6926, is taken by either comparison as
lw_ref, and by the suitability evaluation of 6.7 ascalibrated_power_levels, and read at the conditions of the test.
References
Section titled “References”- International Organization for Standardization. (2010). Acoustics — Determination of sound power levels and sound energy levels of noise sources using sound pressure — Engineering methods for small movable sources in reverberant fields — Part 1: Comparison method for a hard-walled test room (ISO 3743-1:2010). The comparison method of section 1: the room criteria of 4.2 to 4.4, the survey of 7.4, the background correction of 8.1.3, Eq. 14 and Eq. 20, the Table 3 reproducibility and Annexes A and B.
- International Organization for Standardization. (2010). Acoustics — Determination of sound power levels and sound energy levels of noise sources using sound pressure — Precision methods for reverberation test rooms (ISO 3741:2010). The precision reverberation-room method the two parts sit below: the Waterhouse term the special room builds into its reverberation curve, and the C1 + C2 whose altitude figures the informative annexes of ISO 3743 quote.
- International Organization for Standardization. (2018). Acoustics — Determination of sound power levels of noise sources using sound pressure — Engineering methods for small, movable sources in reverberant fields — Part 2: Methods for special reverberation test rooms (ISO 3743-2:2018). The special room of section 2: the reverberation-time curve of 6.3, the surfaces of 6.4, the suitability evaluation of 6.7, Tables 3 and 4, the direct Formula 9 and the comparison Formula 10, the Table 5 reproducibility and Annexes E and F.