Sound reflection of a noise barrier in situ
Standards: EN 1793Key references: Garai & Guidorzi 2000Guidorzi & Garai 2013
A road noise barrier is declared by its absorption, and EN 1793-1 measures that
in a reverberation room: a sample lying on the floor, sound arriving from every
direction, and a product that is not the one standing beside the road. EN
1793-5 measures the same property where the barrier stands, in the direct
sound field of a loudspeaker in front of it, and calls it the sound
reflection index : in each one-third octave band, the energy the device
sends back as a fraction of what reaches it. This page covers
phonometry.environment.propagation.barrier_reflection, which takes the
impulse responses of the measurement to the index, the single number
and the limits the size of the sample puts on both.
1. The set-up
Section titled “1. The set-up”The loudspeaker faces the device at half its height, its front panel = 1,50 m from the reference plane, the plane that touches the most protruding parts of the device. Between them stands a vertical grid of nine microphones, 3 by 3 and 0,40 m apart, its centre (microphone 5) 0,25 m from the plane and so 1,25 m from the loudspeaker. The microphones are numbered as the loudspeaker sees them: 1 to 3 along the top row, 7 to 9 along the bottom.
Each microphone hears the direct sound and, a little over a millisecond later, the reflection. The reflection has travelled further, 1,75 m against 1,25 m at microphone 5, and has spread over a larger sphere; Formula (2) puts that back with , which Table 2 prints for every microphone:
from phonometry import environment
paths = environment.reflection_grid_paths_m()print(paths[4])        # [1.25 1.75]: direct and specular path at microphone 5, mprint(environment.geometric_divergence_corrections().round(2))# [1.8  1.87 1.8  1.87 1.96 1.87 1.8  1.87 1.8 ]
Whether the grid really stands where it should is checked with a reflecting
plate on the reference plane (5.6.2.6): the delay between the direct and the
reflected sound at each microphone, times the speed of sound, has to be within
25 mm of the path difference of Table 3. The same check against a plate 0,25 m
behind microphone 5 (check="relative", 5.6.2.5) compares the direct arrivals
at the eight outer microphones with the one at the centre.
import numpy as np
c = 343.2                                         # m/s at 20 degC# Direct-to-reflected delays read at the nine microphones, in seconds.delays = np.array([0.467, 0.483, 0.470, 0.483, 0.502,                   0.483, 0.440, 0.483, 0.467]) / ccheck = environment.check_reflection_grid_position(delays, speed_of_sound=c)print(check.passes)                               # Falseprint((check.deviations_m * 1e3).round())         # microphone 7 is 27 mm short
The verdict is passes; the object refuses to stand in for it in an if, so a
check is never read as a pass by accident.
2. Taking the direct sound out
Section titled “2. Taking the direct sound out”In front of the device the direct sound and the reflection overlap: a
loudspeaker’s impulse response lasts up to 3 ms (5.4.2) and the reflection
arrives about 1,4 ms after the direct sound. The free-field record, taken with
the loudspeaker and the grid turned away from everything, the ground included,
is the direct sound. Signal subtraction (5.5.4) removes it: the
free-field record is shifted in steps of a fiftieth of a sample, within two
samples either way, by a phase ramp over its own transform; the shift that
best fits the 50 samples around the main peak is kept; the record is scaled so
the two peaks are equal and subtracted. What is left is the reflection, and the
reduction factor of Formula (6) measures how much of the direct
sound went with it: the energy within 0,5 ms of the peak before, over the
energy there after. Below 10 dB the standard reads the subtraction as
imperfect, and so does subtract_direct_sound, with a
BarrierReflectionWarning.
The records below stand in for a measurement at 48 kHz: a loudspeaker pulse at 2,5 kHz, a reflection of 0,35 of the incident amplitude with its top end smoothed, and free-field records taken with the grid 3 µs further away, which is what moving the equipment does.
fs = 48000.0t = np.arange(4800) / fs                          # 100 ms records
def pulse(delay_s):    """A loudspeaker's short impulse response, arriving after delay_s."""    tau = t - delay_s    return np.exp(-0.5 * (tau / 60e-6) ** 2) * np.cos(2 * np.pi * 2500.0 * tau)
smooth = np.hanning(9) / np.hanning(9).sum()free = np.empty((9, t.size))front = np.empty((9, t.size))for k, (direct_m, reflected_m) in enumerate(environment.reflection_grid_paths_m()):    free[k] = pulse(0.01 + direct_m / c + 3e-6) / direct_m    reflection = np.convolve(pulse(0.01 + reflected_m / c), smooth, mode="same")    front[k] = pulse(0.01 + direct_m / c) / direct_m + 0.35 * reflection / reflected_m
sub = environment.subtract_direct_sound(front[4], free[4], fs)print(round(sub.shift_samples, 2), round(sub.reduction_db))   # -0.14 57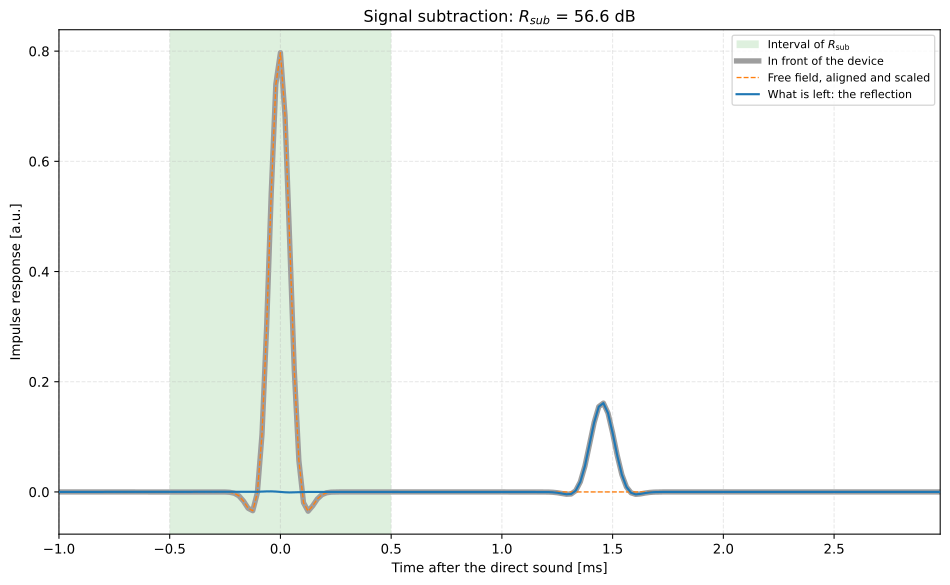
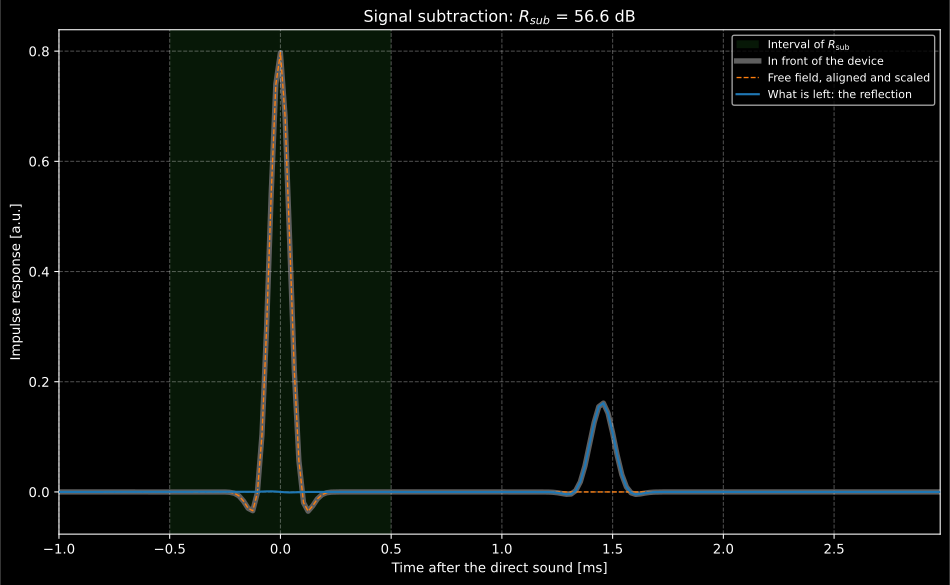
The direct sound goes and the reflection stays: the subtraction found the 0,14 sample shift and left 57 dB less of the direct sound behind.
Show the code for this figure
import matplotlib.pyplot as plt
sub.plot()plt.show()
NOTE 1 of 5.5.4 matters here: the shifted and scaled free-field record serves
the subtraction and nothing else. The index is computed from the original one,
which the result keeps apart as aligned_free_field only so it can be drawn.
3. The Adrienne window
Section titled “3. The Adrienne window”Each component is cut out with the Adrienne temporal window of 5.5.5: a 0,5 ms left half of a four-term Blackman-Harris window, a flat part, and a right half whose length is 3/7 of the flat part. The standard window is 7,9 ms long (0,5 + 5,18 + 2,22 ms); the one that processes all nine microphones from 200 Hz upward is 6,0 ms (0,5 + 3,85 + 1,65 ms); the gain check of 5.5.1 uses 1,3 ms (0,5 + 0,56 + 0,24 ms), short enough to end before the reflection reaches the corner microphones. The marker point where the flat part begins sits 0,2 ms before the peak of the component (5.5.6); for the reflection the peak is placed by geometry, the direct peak plus , which is what makes the reference plane the conventional reflection plane of a device that is not flat.
window = environment.adrienne_reflection_window(fs, environment.ADRIENNE_SHORT_LENGTH_S)print(window.size) # 288 samples at 48 kHzprint(round(environment.adrienne_low_frequency_limit_hz(7.9e-3), 1)) # 162.5 HzThe edges are Formula (7) sampled as printed, each a half of a full Blackman-Harris window twice its own length. Table 1 calls the length of the trailing edge, which read into Formula (7) would draw a whole bell where the edge should fall; the errata registry records it. The second line is the window’s low frequency limit, the subject of section 5.
4. The index, band by band
Section titled “4. The index, band by band”Formula (1) averages, over the microphones, the ratio of the reflected to the incident energy in each band, with three corrections; the gain factor divides here, as the library computes it (see below):
- is the divergence of section 1.
- puts back the directivity of the loudspeaker: the reflection
left it towards the specular point, at another angle than the direct sound.
It is measured once per loudspeaker (Formula (3)), in free field, at the
microphone position and on the specular path at the same distance, and
source_directivity_correctionsturns the two sets of records into the(9, 18)arrayreflection_indextakes. A report without it states “none”, and so does leaving it out. - takes out a change of gain between the free-field and the in-front configurations. Formula (4) measures it as the in-front incident energy over the free-field one, with the 1,3 ms window over the bands of 500 Hz to 2 kHz. The library divides by it. Formula (1) prints it as a multiplier, and since Formula (4) makes it the gain change itself, a multiplier would square the change instead of removing it; the errata registry records the case. Above 20 % the standard reads the change as a sign the settings moved, and the function warns.
In the bands of 100 Hz, 125 Hz and 160 Hz the average is over microphones 1 to 6 with the 7,9 ms window, because the bottom row meets the ground reflection first; from 200 Hz it is over all nine with the 6,0 ms window.
result = environment.reflection_index(front, free, fs, speed_of_sound=c)print(result.reflection_index.round(2))# [0.12 0.12 0.12 0.12 0.12 0.12 0.12 0.12 0.12 0.12 0.12 0.12 0.11 0.11#  0.1  0.08 0.07 0.05]print(result.rating.reported)                  # 9 dB from the 200 Hz bandprint(result.gain_corrections[0, 4].round(3))  # 1.0: no gain changed
on_axis, specular = free, 0.95 * free          # a loudspeaker 5 % weaker off axisdirectivity = environment.source_directivity_corrections(on_axis, specular, fs)print(directivity[4, 10].round(3))             # 1.108 at 1 kHz
A reflection of 0,35 of the amplitude comes back as 0,12, its square, and
falls where the smoothing took the top end off. The result keeps
every microphone’s index (microphone_values, nan where 5.5.5 leaves a
microphone out), every gain factor and every reduction factor, so a report can
state them. Several grid positions, the A, B and C of a device that is not flat
or not homogeneous (5.6.2.3), go in as a (positions, 9, N) array and are
averaged over every microphone of every position. The records can also
arrive as the nine-channel Signal objects the reader returns, one per grid
position: the rate and the calibration come with them, and fs is left out.
The speed of sound has no default, because 5.5.6 and 5.7.3 ask for its value at
the temperature of the test.
5. How low a sample can be measured
Section titled “5. How low a sample can be measured”The reflected window has to end before two unwanted arrivals reach the
microphone: the sound reflected by the ground in front of the device, and
the sound diffracted by its edges (5.5.7). A lower device brings both
earlier, allows a shorter window, and a shorter window reaches less far down.
The standard gives the result for a device longer than it is high only as the
three curves of Figure 14, without the formula behind them.
reflection_low_frequency_limit computes it by the construction of the
method’s authors (Garai and Guidorzi, 2000): the window’s flat part and
trailing edge last exactly the delay between the reflection and the first
unwanted component, and its limit is the first notch in the spectrum of that
window, 162,5 Hz for the 7,9 ms one, which the paper gives as about 160 Hz.
limit = environment.reflection_low_frequency_limit(3.5, speed_of_sound=c)print(limit.low_frequency_limit_hz.round())# [220. 217. 220. 211. 208. 211. 265. 262. 265.]print(limit.limiting_component[1], limit.limiting_component[7]) # top edge ground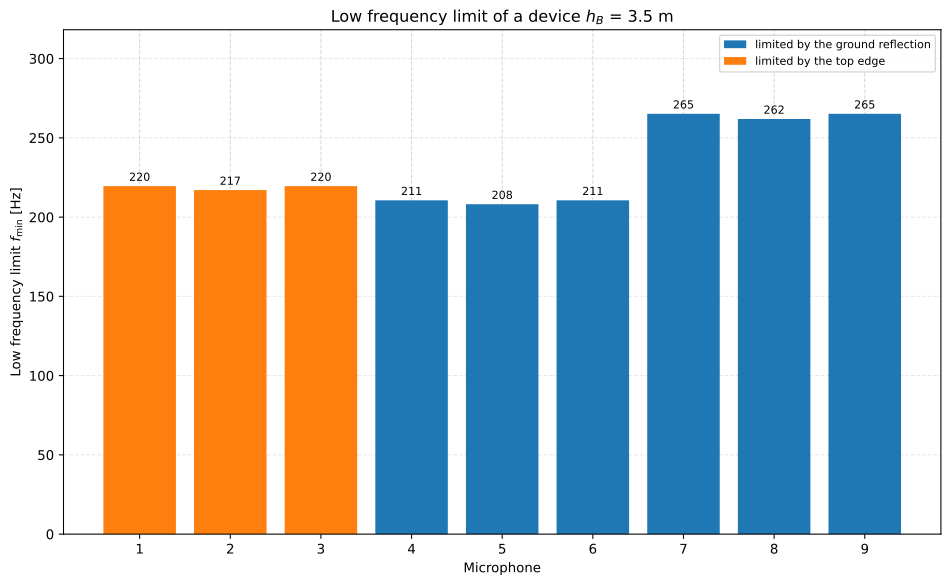
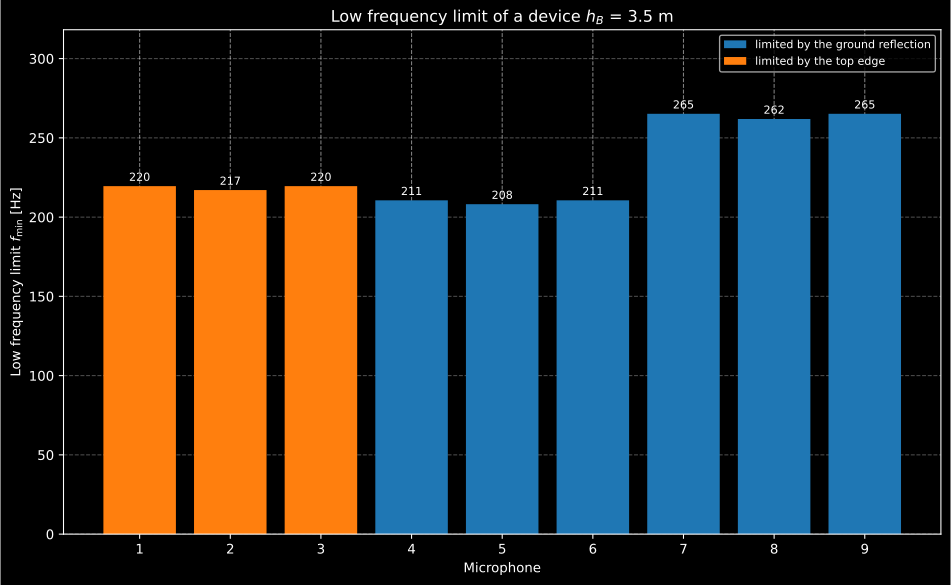
In this construction the top edge cuts the top row short and the ground the bottom row, so the middle row reaches lowest; Figure 14 of the standard gives microphone 2 the lowest limit (compared below).
Show the code for this figure
limit.plot()plt.show()Against what the standard prints, the construction agrees at the centre of the grid and not at its top and bottom rows:
| 4 m sample, 340 m/s | 5.5.7 text | Figure 14 | This construction |
|---|---|---|---|
| Microphone 2 | about 160 Hz | 160 Hz | 176 Hz (top edge) |
| Microphone 5 | about 170 Hz | 170 Hz | 167 Hz (ground) |
| Microphone 8 | about 220 Hz | 220 Hz | 201 Hz (ground) |
The Figure 14 column is read off the printed curves, to about 1 %. Microphone 5 follows its curve within 5 % from 2,75 m up, and is 5,5 % below it at 2,5 m. At microphone 2 the top edge, which 5.5.7 names as a component to keep out, arrives before the ground reflection and puts the limit about 3 % to 10 % above the curve at every height; at microphone 8 the limit is a third below the curve at 2,5 m, 6 % below at 4,5 m and 3 % or less from 6 m up, below it throughout. Neither outer curve comes out of the ground reflection, the top edge or any mix of them at the heights of the grid, so the figure could not be rebuilt. For the 3,5 m barrier of 5.8 the highest limit comes out at 265 Hz where the standard states 300 Hz. The limit is therefore reported, not used to pick a band: the lowest reliable band of the single number is the caller’s, and the two examples the standard gives for choosing it read a limit against the bands in opposite directions (the 4 m sample keeps its 200 Hz band with a limit of 220 Hz, the 3,5 m barrier loses its 315 Hz band with a limit of 300 Hz), which the errata registry also records.
The side edges come in with device_length_m, for a sample narrower than it
is high. reflection_sampled_area_radius_m gives the other size that matters,
the radius around the point of incidence that must stay free of reflecting
objects (Formula (8)): 1,96 m for the 7,9 ms window at 340 m/s, the value of
NOTE 1 of 5.6.1.
6. The single number, and Annex B
Section titled “6. The single number, and Annex B”The index is weighted by the normalised traffic noise spectrum of EN 1793-3, from the lowest reliable band up (Formula (12)):
It is reported to the nearest integer and carries no category ladder. For the
qualification sample of 4 m by 4 m the lowest band is 200 Hz, the default; a
smaller device reports its range with the number, DL_RI (400 - 5 000 Hz) for
the 3,5 m barrier of 5.8. The clause copies the 0,99 limit on the ratio from EN
1793-1, where it keeps a logarithm defined; here a device reflecting more than
it receives would simply rate below zero, but the limit is applied as printed,
with a warning.
Annex B reports a 4 m absorptive barrier measured at twelve grid positions,
each position one column of “particular values”, and the declared index as their
mean. reflection_index_from_positions recomputes it:
table_b1 = [   # EN 1793-5 Table B.1: twelve grid positions per band    [0.59, 0.62, 0.57, 0.55, 0.58, 0.59, 0.57, 0.57, 0.51, 0.61, 0.61, 0.62],    [0.60, 0.62, 0.58, 0.54, 0.57, 0.58, 0.58, 0.58, 0.51, 0.60, 0.59, 0.61],    [0.63, 0.65, 0.60, 0.55, 0.57, 0.59, 0.60, 0.60, 0.53, 0.60, 0.57, 0.60],    [0.38, 0.42, 0.31, 0.37, 0.37, 0.35, 0.37, 0.39, 0.31, 0.36, 0.31, 0.32],    [0.43, 0.47, 0.35, 0.39, 0.39, 0.36, 0.42, 0.43, 0.35, 0.38, 0.34, 0.36],    [0.43, 0.45, 0.34, 0.37, 0.37, 0.34, 0.37, 0.37, 0.33, 0.33, 0.33, 0.33],    [0.34, 0.33, 0.26, 0.28, 0.30, 0.27, 0.22, 0.24, 0.22, 0.21, 0.25, 0.23],    [0.15, 0.15, 0.12, 0.13, 0.15, 0.15, 0.07, 0.08, 0.08, 0.11, 0.12, 0.12],    [0.05, 0.04, 0.04, 0.07, 0.05, 0.06, 0.06, 0.04, 0.04, 0.09, 0.05, 0.06],    [0.07, 0.07, 0.06, 0.13, 0.08, 0.07, 0.17, 0.11, 0.09, 0.11, 0.09, 0.07],    [0.11, 0.10, 0.09, 0.13, 0.11, 0.08, 0.17, 0.16, 0.10, 0.08, 0.07, 0.04],    [0.11, 0.13, 0.10, 0.07, 0.11, 0.08, 0.10, 0.13, 0.09, 0.10, 0.09, 0.07],    [0.39, 0.53, 0.16, 0.37, 0.28, 0.21, 0.30, 0.23, 0.18, 0.30, 0.35, 0.29],    [0.19, 0.28, 0.10, 0.20, 0.15, 0.12, 0.16, 0.15, 0.08, 0.13, 0.17, 0.22],    [0.15, 0.23, 0.21, 0.14, 0.13, 0.17, 0.15, 0.15, 0.16, 0.12, 0.15, 0.10],    [0.31, 0.33, 0.27, 0.26, 0.23, 0.19, 0.18, 0.25, 0.18, 0.16, 0.23, 0.21],    [0.39, 0.27, 0.22, 0.23, 0.26, 0.21, 0.28, 0.22, 0.18, 0.28, 0.21, 0.24],    [0.55, 0.43, 0.25, 0.52, 0.53, 0.53, 0.40, 0.43, 0.23, 0.46, 0.36, 0.45],]annex_b = environment.reflection_index_from_positions(np.array(table_b1).T)print(annex_b.reflection_index.round(2)[4:10])  # [0.39 0.36 0.26 0.12 0.05 0.09]print(annex_b.rating.reported)                 # 8 dB, as printed under the tableprint(round(annex_b.rating.rating, 2))         # 7.65 dB before rounding, see below
u_bands, u_rating = annex_b.expanded_uncertainty()   # Table A.1, high column, k = 1.96print(round(u_rating, 2))                            # 1.59 dB, Table B.2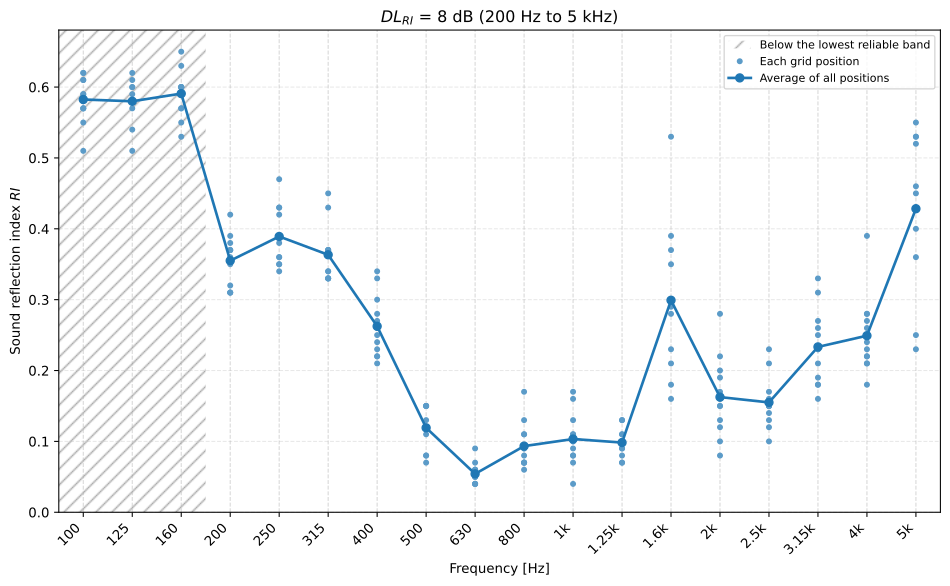
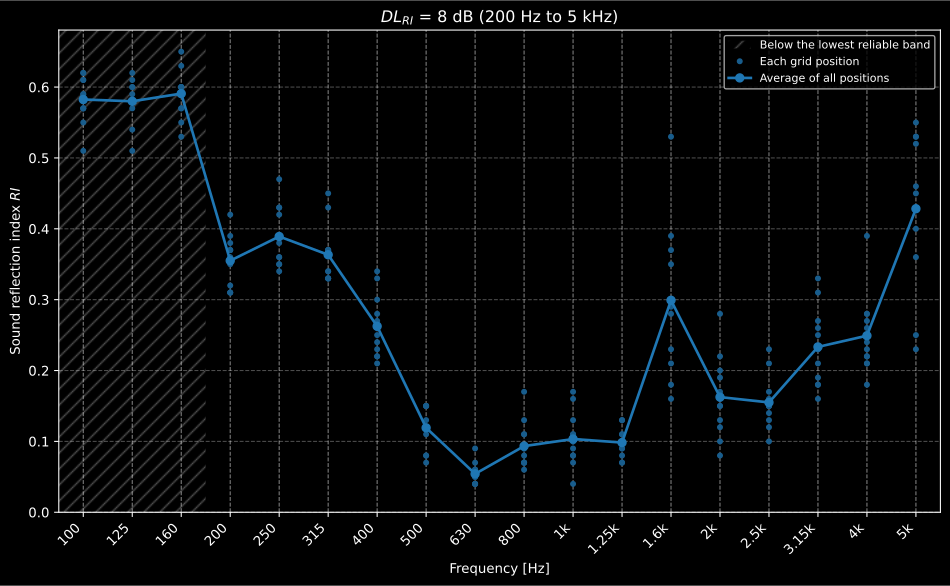
Twelve positions along an absorptive barrier: little comes back between 500 Hz and 1,25 kHz, where the traffic spectrum weighs most, and the posts and the perforated face show above.
Show the code for this figure
annex_b.plot()plt.show()Every one of the eighteen averages of Table B.1 comes out of its twelve
particular values: sixteen to the hundredth, and two, at 200 Hz and 2,5 kHz,
fall exactly on a half and are printed one down and one up, which is what
averages of unrounded particular values would give. Formula (12) on the
printed averages gives the 7,68 dB of Table B.2 before rounding. On the
particular values themselves, which is what annex_b.rating.rating holds, it
gives 7,65 dB: the 7,68 dB is Formula (12) on averages rounded to two
decimals, the resolution 5.11 reports the index to. Both round to the 8 dB
printed. The expanded uncertainty is the reproducibility of the
inter-laboratory test in Table A.1 times the coverage factor, 1,59 dB for the
single number; in seven bands Table B.2 prints a hundredth less than 1,96
times the of Table A.1, as unrounded standard deviations would give. The
print does not say which values the example multiplied, and the library
multiplies the printed ones.
Relation to the other parts of EN 1793
Section titled “Relation to the other parts of EN 1793”The declaration of a road device (Spherical ground effect and advanced
barriers)
carries from EN 1793-1 and from EN 1793-2, both from a
laboratory. answers the question of again, in the direct
field beside the road rather than the diffuse field of a reverberation room,
on the product as built; the two do not convert into each other, and a
declaration that states both is stating two things. The three single numbers
share one function family and one result, RoadDeviceRating, whose quantity
says which it is.
What this guide covers
Section titled “What this guide covers”Covered
EN 1793-5:2016 from the impulse responses on: the geometry of the grid and Formula (2) (Table 2), the signal subtraction with its sub-sample alignment and the reduction factor of Formula (6) (5.5.4), the Adrienne window of 5.5.5 with Formula (7) and its placement (5.5.6), the sound reflection index of Formula (1) with the directivity correction of Formula (3) and the gain factor of Formula (4), the averages of 5.5.5 and 5.6.2.3 over microphones and grid positions, the single number of 5.8 with the EN 1793-3 spectrum, the sampled area of Formula (8), the two position checks of 5.6.2.5 and 5.6.2.6 against Table 3, the expanded uncertainty from Table A.1, and the low frequency limit of 5.5.7 by the construction of Garai and Guidorzi. Tables 2 and 3, NOTE 1 of 5.6.1, the three windows and the example of Annex B (Tables B.1 and B.2) are conformance checks.
Not covered
Obtaining the impulse responses, by MLS or sweep and deconvolution (5.4.3), which is the room impulse response machinery; the anti-aliasing filter of 5.5.2 and the signal-to-noise ratio of 5.5.3, which a laboratory states rather than computes; the meteorological and surface conditions of 5.7; and the far-field indicators of Annex C, which the standard leaves to the QUIESST reports. The low frequency limit follows Figure 14 at microphone 5 and not at microphones 2 and 8, so it does not choose the lowest reliable band: that stays with the report.
References
Section titled “References”- European Committee for Standardization. (1997). Road traffic noise reducing devices - Test method for determining the acoustic performance - Part 3: Normalized traffic noise spectrum (EN 1793-3:1997). Table 1, the eighteen relative A-weighted one-third octave band levels DL_RI is weighted by. Read from the BS EN 1793-3:1998 edition.
- European Committee for Standardization. (2016). Road traffic noise reducing devices - Test method for determining the acoustic performance - Part 5: Intrinsic characteristics - In situ values of sound reflection under direct sound field conditions (EN 1793-5:2016). The implemented edition: the grid and its geometry (3.10 to 3.15, Tables 2 and 3), Formula (1) with the corrections of Formulas (2) to (4), the subtraction and Formula (6) of 5.5.4, the Adrienne window of 5.5.5 and Formula (7), its placement (5.5.6), the low frequency limit (5.5.7), the sampled area of Formula (8), the position checks of 5.6.2.5 and 5.6.2.6, DL_RI (5.8), Table A.1 and the example of Annex B. Read from BS EN 1793-5:2016.
- Garai, M., & Guidorzi, P. (2000). European methodology for testing the airborne sound insulation characteristics of noise barriers in situ: experimental verification and comparison with laboratory data. The Journal of the Acoustical Society of America, 108(3), 1054-1067. https://doi.org/10.1121/1.1286811Section III.D: the window that ends where the first unwanted component arrives, and the first notch of its spectrum as the low frequency limit, about 160 Hz for the 7,9 ms window. The construction behind the low frequency limit here.
- Guidorzi, P., & Garai, M. (2013). Advancements in sound reflection and airborne sound insulation measurement on noise barriers. Open Journal of Acoustics, 3(2A), 25-38. https://doi.org/10.4236/oja.2013.32A004The QUIESST revision the 2016 standard adopted: the nine-microphone grid, the sub-sample alignment and the directivity correction.