Resource Benchmark
Nothing else published about this server says what it costs to run. This page does: resident memory, processor time, goroutine count and per-method latency, measured on both transports across the settings that move them.
What is measured
Section titled “What is measured”Six axes, chosen because they are the ones that move the numbers:
| Axis | Values | Why it matters |
|---|---|---|
| Transport | stdio, HTTP | stdio gives every client its own process; HTTP serves everyone from one, pooling credential state per token and one built catalog per configuration |
| Tool surface | dynamic, meta, individual | The dynamic surface registers two tools and the individual one roughly a thousand |
| Concurrent clients | 8 processes on stdio, 64 credentials on HTTP | On HTTP the pool holds one entry per token, so this is the axis a shared deployment grows along |
| Parallel requests | 2 to 4 in flight per client | Separates the cost of having clients from the cost of them all calling at once |
| Telemetry | off, on | Exporting is work the server would not otherwise do |
| Credentials at scale | 1 to 1000 on HTTP, one series per surface | A shared deployment meets hundreds of tokens; the series measures the slope and the latency knee instead of multiplying a per-token figure |
Four metrics, taken from the operating system and from the wire rather than from inside the program:
- Resident set, in mebibytes, at four moments: idle, with one client, with every client, and at its peak under load. It is read from the kernel rather than from Go’s own heap accounting, because the resident set is what a container limit is measured against: the two differ by more than a factor of two, and only one of them gets a process killed.
- Processor time, split into what building the surfaces cost and what serving the requests cost. The load figure is a percentage of one core, so above 100% means several cores were busy.
- Goroutine count, at rest, with every client attached.
- Latency percentiles, per MCP method, from the client’s side of the wire.
The concurrency series records, at each credential count: the resident set over
the steady phase, as a mean and a peak; the settled live heap and the settled
resident set, read once that phase has stopped; processor time per completed
call; the p50 and p99 of tools/call and of tools/list; the goroutine count;
the pool counters the driver knows (the entries admitted and the capacity it
sized the pool to); and a CPU profile and a heap profile of the server, kept
beside the record for the analysis rather than committed.
How this was measured
Section titled “How this was measured”The real binary, built from the current checkout and started the way a client
starts it, on both transports. A harness that reassembled the server from the
same packages would be reporting on its own copy, and would miss the readiness
gate, the authentication chain, the pool and the flag parsing, which is most of
what an operator is sizing for. GitLab is stood in by an HTTP server inside the
harness, answering the version and user endpoints the server probes while it
builds a pool entry and 404 for the scope and tier probes, which every caller
reads as “this instance will not say”. A run therefore needs no instance, no
credentials and no network, and two people re-measuring compare this server
rather than their GitLab installations. The OTLP collector is stood in the same
way, so the telemetry scenarios measure what exporting costs rather than what a
collector does with the payload. The tool surface is passed explicitly rather
than read from the environment, so a developer machine and CI measure the same
thing, and the environment a measured process inherits is stripped of every
variable this server reads.
A few details change what the numbers mean:
- The rate limiter is off (
--rate-limit-rps=0) in every scenario on this page. HTTP mode defaults to ten requests a second, which a benchmark firing parallel requests would spend its time being refused by, so a capacity figure measured with it on would be the cost of saying no. Refusals are a different measurement:test/e2e/httpchecks that they happen, andmake bench-fairnessmeasures whether they help anybody, in an opt-in mode that publishes nothing here. - The harness speaks JSON-RPC directly, not through the Go SDK. From
protocol 2026-07-28 a client may serve
tools/listfrom its own cache, and the SDK client does: measured through it, a listing that costs the server hundreds of milliseconds returns in microseconds without a request ever leaving the process. What is published here is the work the server does; a caching client pays it less often, and never less than once per session. - Protocol 2026-07-28 has no handshake. It removed
initializeandping, so the first thing a client waits for is its first real request, and the startup figures are anchored on the firsttools/list. - The point scenarios take the goroutine count from a traceback signal.
They start the server without its profile listener, so the process is the one
an operator runs, and the only way to ask is
SIGQUITwithGOTRACEBACK=all, which prints every goroutine’s stack and ends the process; it is the last thing each scenario does. The series reads the count off--pprof-addrinstead, which leaves the process alive for the next step. - Percentiles are nearest-rank, so every published percentile is a value that was actually observed rather than one interpolated between two that were.
The Measurements section below is regenerated by one command,
make bench-resources, which runs the benchmark and redraws the charts and
tables from the record it writes; the prose around it is written by hand. The
machine, the build and the method are named in the text under the heading, and
every chart repeats along its bottom edge the part of that a figure read away
from this page cannot do without: how many logical processors measured, on
which operating system and kernel, and when.
This page is a snapshot, and only a snapshot. A new measurement on the reference host replaces these values wholesale: no “before” column, no ratio against an earlier run, no history. A figure compared against a run whose code no longer exists says nothing about the instance you are sizing. What moved between measurements, and why, is kept in Resource Hot Spots, and what a change was for in its ADR.
The point scenarios run 64 credentials on HTTP and 8 processes on stdio,
admitting them one at a time and then loading all of them at once. 64 sits past
the point where the host saturates and below the pool’s own default bound of
100, so the scenario runs the shipped default and measures real contention; a
point scenario passes no pool flag, and nothing it admitted is evicted before it
is measured. 8 on stdio, because each one is a whole process with its own
catalog and eight concurrent clients is a busy developer machine. The point
scenarios stay out of the series’ way: one to a thousand credentials is the
series’ question, and they exist for the axes it does not measure at all, which
are stdio, telemetry, resources/list latency, the goroutine count of a
process with no profile listener, and the serial ramp itself.
A shared deployment meets hundreds, so the benchmark also runs a concurrency
series per surface: one HTTP process, given 1, 2, 5, 10, 20, 50, 100, 200,
500 and 1000 distinct credentials in turn, each warmed with a tools/list, and
measured over a ten-second steady phase at each count in which every credential
keeps calling tools/call and tools/list. Each step records the resident set
(mean and peak), processor time per call, the p50 and p99 of both methods and
the goroutine count, and captures a CPU and a heap profile of the server
through its --pprof-addr listener, which the analysis reads and the site does
not publish.
The series process is started with --pprof-addr on a loopback port the
driver picks and --max-http-clients set to the largest count, so nothing a
step admitted is evicted before the next step measures it. -clients replaces
the list of counts, and -quick uses 1, 2 and 5. At each count the driver:
- Admits the new credentials, eight at a time, each warmed with one cold
tools/listso the pool holds a built entry for it. - Runs a steady phase of ten seconds (
-step-duration) in which every credential keeps the scenario’s parallelism in flight, each worker alternatingtools/callandtools/list. A fixed duration rather than a fixed call count, because a CPU profile is taken over wall-clock seconds and a count that took seconds at one credential would take unbounded time once latency degrades, which is the region the series exists to reach. Every per-call figure divides by the calls that actually completed. - Profiles the server while it serves: a CPU profile over the first 80% of
the phase and, as the phase ends, a heap profile taken after a collection
and the goroutine total. Profiles land under
bench/profiles/<scenario>/<clients>.cpu.pb.gzand<clients>.heap.pb.gz(-profiles), which git ignores. - Takes a settled reading: with the load stopped, the process is left
alone for half a second, a collection is forced, and the live heap is read
with the resident set beside it. It is the same measurement the end-to-end
test
TestSharedServer_LiveHeapDoesNotGrowWithTheNumberOfCredentialsmakes on every push, taken here at every step of the ladder.
Telemetry stays off for the series, so it measures the same server the point scenarios do.
Each step is then measured a second time, with the load stopped. The two readings answer different questions: the resident set over the steady phase is what N credentials cost while all of them are calling, and the settled reading, taken after the load ends with a collection forced, is what they cost to hold. The first is measured in megabytes per credential and the second in kilobytes, so one is never a substitute for the other. The settled resident set is recorded beside the settled heap and lags it, because freeing a heap does not hand the pages back: Go’s scavenger returns them on its own schedule.
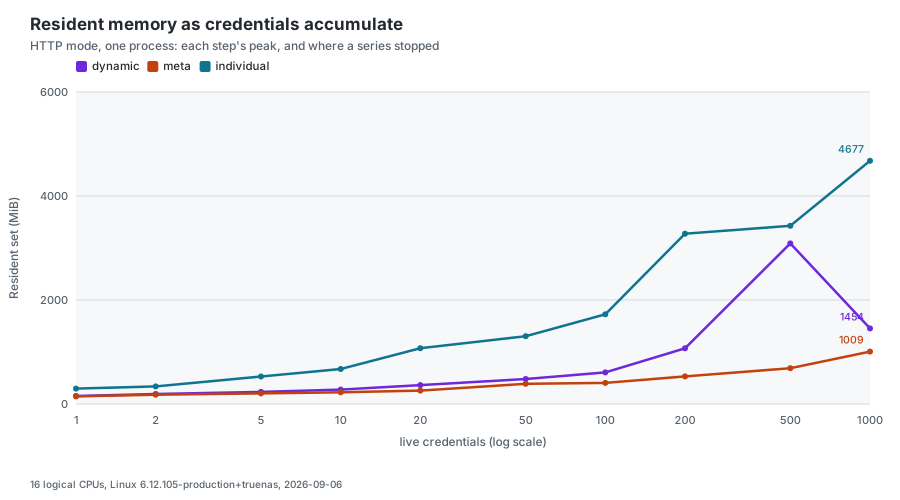
On the reference host the two are not close. At a thousand credentials on the
dynamic surface the peak resident set was 1454 MiB against a settled live heap
of 88.3 MiB, a factor of sixteen. The heap profiles say what the difference is
made of, read first step against last. On dynamic the entries that build the
catalog do not move: toolutil.cloneSchemaMap holds 10.0 MiB at one credential
and 10.0 MiB at a thousand, and so do the search index, the action catalog and
the schema maps beneath them. What grows is the connections and the
credentials: the bufio reader and writer of each open socket, absent from the
profile at one credential and 35.6 MiB across the four thousand held at the
last step, and the GitLab client of each pool entry, 5.0 MiB across a thousand
of them. The rest of the gap never reaches the settled figure at all, because
it is the JSON of the calls that were in flight when the load stopped.
A series stops early rather than take the host down: before each step the
resident set it would reach is estimated from the steps so far, a straight line
fitted through their peaks (with a single step to go on, the extrapolation is
proportional, which errs toward stopping early), and the rest of the list is
skipped when the estimate exceeds the memory budget: -memory-budget, in MiB,
or 80% of the host’s available memory (MemAvailable in /proc/meminfo) read
when the run starts. A host that does not report it runs with no budget, and
the series says so. A step whose tools/call p99 passes 30 seconds is the last
one run, since past that a client has given up and the next step would measure
timeouts rather than the server. Where a series stopped, and why, is printed
under its table. In the run published here none of them stopped: all three
reached a thousand credentials.
Measurements
Section titled “Measurements”Measured on Intel(R) Core(TM) i5-14400, 16 logical CPUs, 62 GiB RAM, linux/amd64, kernel 6.12.105-production+truenas, go1.27.1, build 2.7.6-0.20260906081503-18bed59da189 (18bed59d), 2026-09-06T08:24:43Z. 3 rounds per method, resident set sampled every 100 ms.
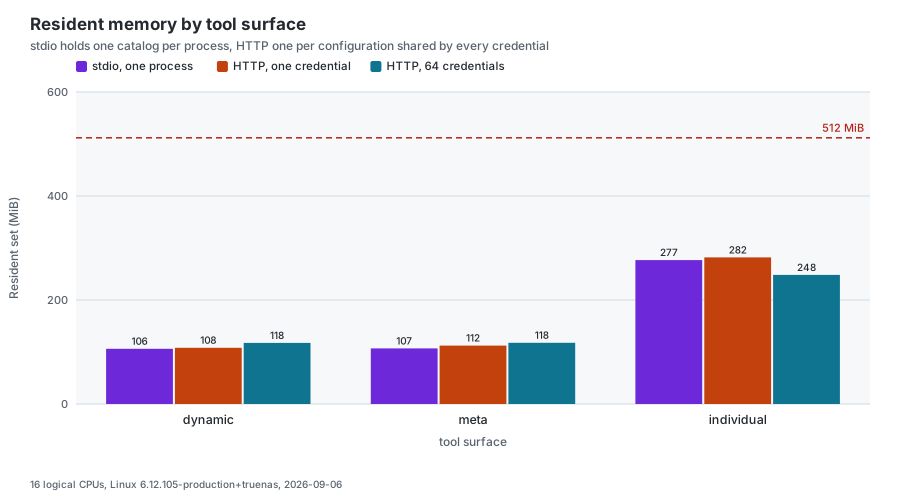
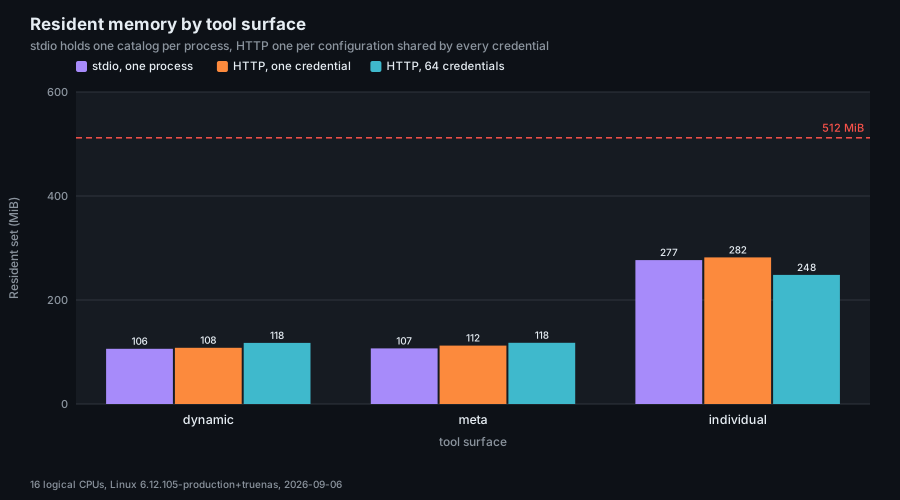
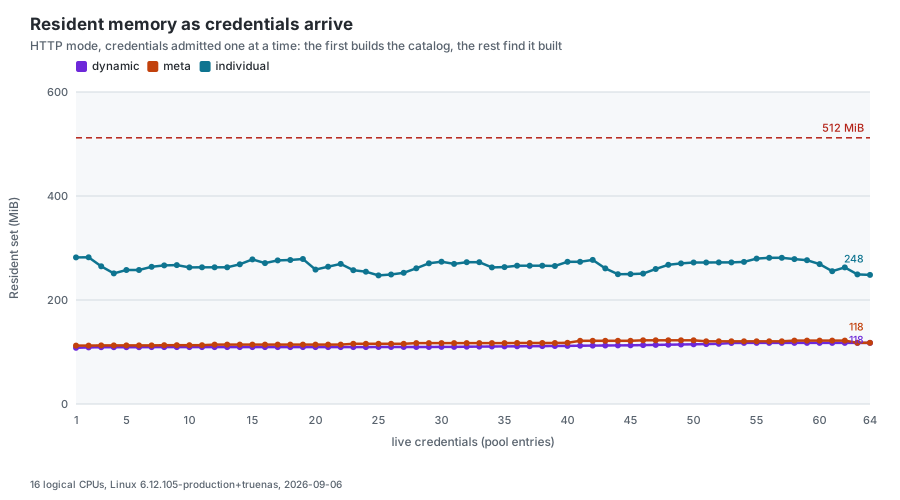
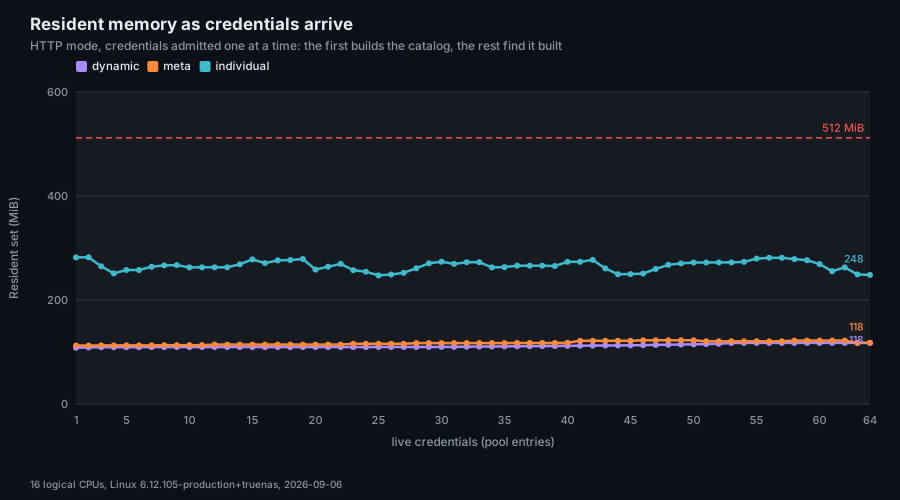
Memory, goroutines and processor time per scenario
Section titled “Memory, goroutines and processor time per scenario”| Scenario | Clients | Idle | One client | All clients | Per extra client | Peak | Goroutines | CPU, % of one core |
|---|---|---|---|---|---|---|---|---|
| stdio, dynamic | 8 | n/a | 106 | 849 | 106 | 995 | 34 | 1039% |
| stdio, meta | 8 | n/a | 107 | 857 | 107 | 1018 | 36 | 794% |
| stdio, individual | 8 | n/a | 277 | 2134 | 265 | 2291 | 36 | 1120% |
| stdio, dynamic, telemetry | 8 | n/a | 111 | 893 | 112 | 1048 | 43 | 1080% |
| http, dynamic | 64 | 35 | 108 | 118 | 0 | 375 | 291 | 974% |
| http, meta | 64 | 37 | 112 | 118 | 0 | 324 | 293 | 928% |
| http, individual | 64 | 36 | 282 | 248 | -1 | 1422 | 165 | 1147% |
| http, dynamic, telemetry | 64 | 38 | 113 | 122 | 0 | 383 | 300 | 1018% |
What a client waits for, per scenario
Section titled “What a client waits for, per scenario”| Scenario | Process ready | First tools/list | Warm tools/list (p50) | tools/list payload |
|---|---|---|---|---|
| stdio, dynamic | 0.26 | 351 | 1.9 | 12 KB |
| stdio, meta | 0.17 | 341 | 42 | 598 KB |
| stdio, individual | 0.18 | 1279 | 379 | 3.2 MB |
| stdio, dynamic, telemetry | 0.24 | 333 | 1.7 | 12 KB |
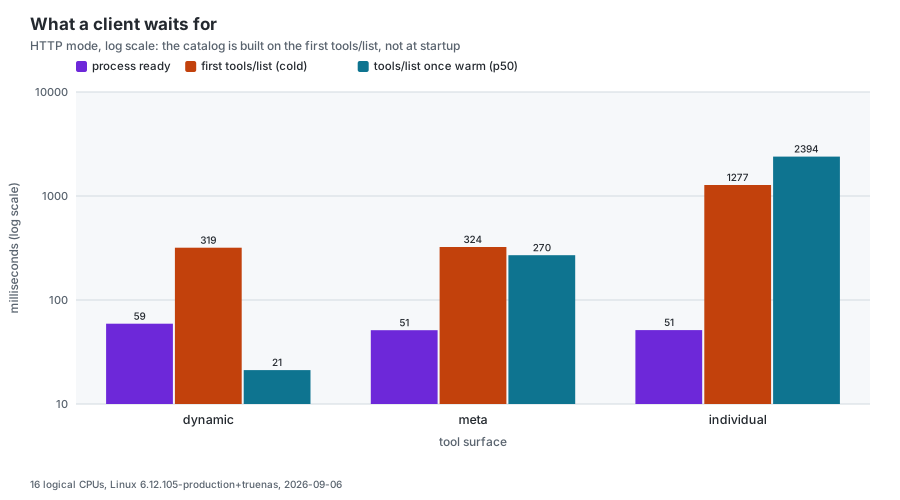
| http, dynamic | 59 | 319 | 21 | 12 KB |
| http, meta | 51 | 324 | 270 | 599 KB |
| http, individual | 51 | 1277 | 2394 | 3.2 MB |
| http, dynamic, telemetry | 51 | 319 | 20 | 12 KB |
Latency percentiles per method
Section titled “Latency percentiles per method”| Scenario | Method | Call | p50 | p90 | p99 | Max |
|---|---|---|---|---|---|---|
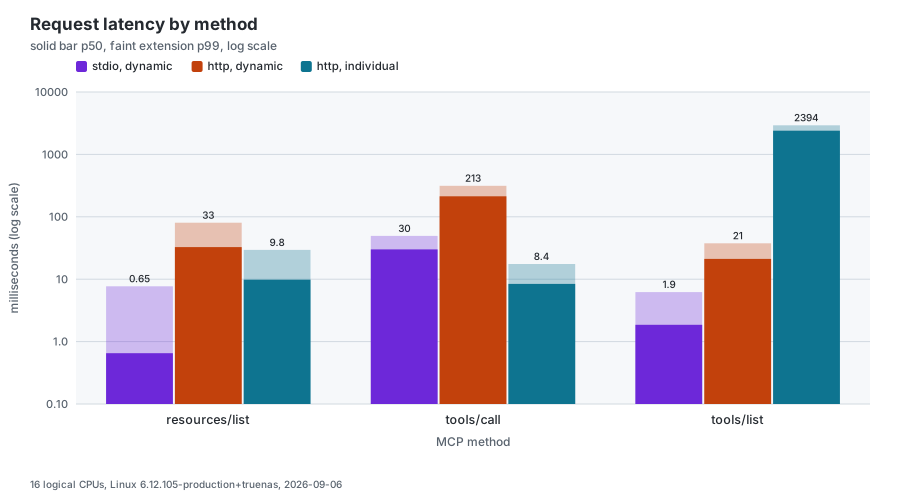
| stdio, dynamic | resources/list | smallest listing | 0.65 | 7.6 | 7.7 | 7.7 |
| stdio, dynamic | tools/call | gitlab_find_action | 30 | 41 | 49 | 49 |
| stdio, dynamic | tools/list | whole surface | 1.9 | 6.0 | 6.2 | 6.2 |
| stdio, meta | resources/list | smallest listing | 0.64 | 0.99 | 1.2 | 1.2 |
| stdio, meta | tools/call | gitlab_server (status) | 1.7 | 40 | 41 | 41 |
| stdio, meta | tools/list | whole surface | 42 | 51 | 55 | 55 |
| stdio, individual | resources/list | smallest listing | 0.57 | 0.78 | 0.93 | 0.93 |
| stdio, individual | tools/call | gitlab_server_status | 0.87 | 1.4 | 1.8 | 1.8 |
| stdio, individual | tools/list | whole surface | 379 | 405 | 424 | 424 |
| stdio, dynamic, telemetry | resources/list | smallest listing | 0.79 | 0.87 | 0.95 | 0.95 |
| stdio, dynamic, telemetry | tools/call | gitlab_find_action | 30 | 47 | 50 | 50 |
| stdio, dynamic, telemetry | tools/list | whole surface | 1.7 | 2.3 | 2.6 | 2.6 |
| http, dynamic | resources/list | smallest listing | 33 | 48 | 80 | 85 |
| http, dynamic | tools/call | gitlab_find_action | 213 | 307 | 314 | 314 |
| http, dynamic | tools/list | whole surface | 21 | 35 | 38 | 38 |
| http, meta | resources/list | smallest listing | 10 | 55 | 62 | 66 |
| http, meta | tools/call | gitlab_server (status) | 23 | 31 | 33 | 34 |
| http, meta | tools/list | whole surface | 270 | 388 | 403 | 404 |
| http, individual | resources/list | smallest listing | 9.8 | 13 | 30 | 30 |
| http, individual | tools/call | gitlab_server_status | 8.4 | 16 | 18 | 18 |
| http, individual | tools/list | whole surface | 2394 | 2855 | 2929 | 2949 |
| http, dynamic, telemetry | resources/list | smallest listing | 14 | 53 | 59 | 61 |
| http, dynamic, telemetry | tools/call | gitlab_find_action | 213 | 301 | 314 | 315 |
| http, dynamic, telemetry | tools/list | whole surface | 20 | 35 | 36 | 37 |
Concurrency series
Section titled “Concurrency series”http, dynamic surface: 4 in flight per credential, 10 s per step
Section titled “http, dynamic surface: 4 in flight per credential, 10 s per step”| Credentials | Resident, mean | Resident, peak | Settled heap | Settled resident | CPU per call | Calls | tools/call p50 | tools/call p99 | tools/list p50 | tools/list p99 | Goroutines |
|---|---|---|---|---|---|---|---|---|---|---|---|
| 1 | 143 | 154 | 39.0 | 106 | 7.394 | 6895 | 11 | 14 | 0.96 | 3.4 | 18 |
| 2 | 172 | 192 | 39.1 | 107 | 7.633 | 11070 | 13 | 18 | 1.1 | 4.7 | 22 |
| 5 | 217 | 232 | 39.2 | 109 | 7.910 | 13684 | 23 | 43 | 3.9 | 16 | 36 |
| 10 | 241 | 277 | 39.5 | 110 | 7.971 | 13660 | 43 | 118 | 7.5 | 53 | 56 |
| 20 | 289 | 364 | 40.0 | 115 | 7.843 | 14254 | 75 | 274 | 11 | 147 | 96 |
| 50 | 414 | 481 | 41.5 | 122 | 7.629 | 16777 | 151 | 766 | 11 | 471 | 216 |
| 100 | 547 | 608 | 44.0 | 133 | 7.639 | 17482 | 269 | 1578 | 15 | 956 | 416 |
| 200 | 869 | 1070 | 48.9 | 157 | 7.674 | 17851 | 406 | 3572 | 20 | 1757 | 816 |
| 500 | 1958 | 3089 | 64.0 | 232 | 7.851 | 17187 | 911 | 9313 | 52 | 4188 | 2015 |
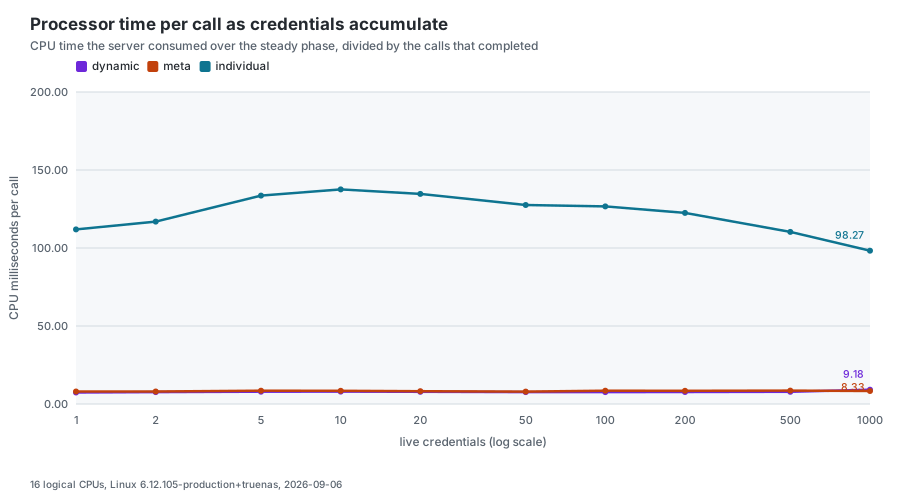
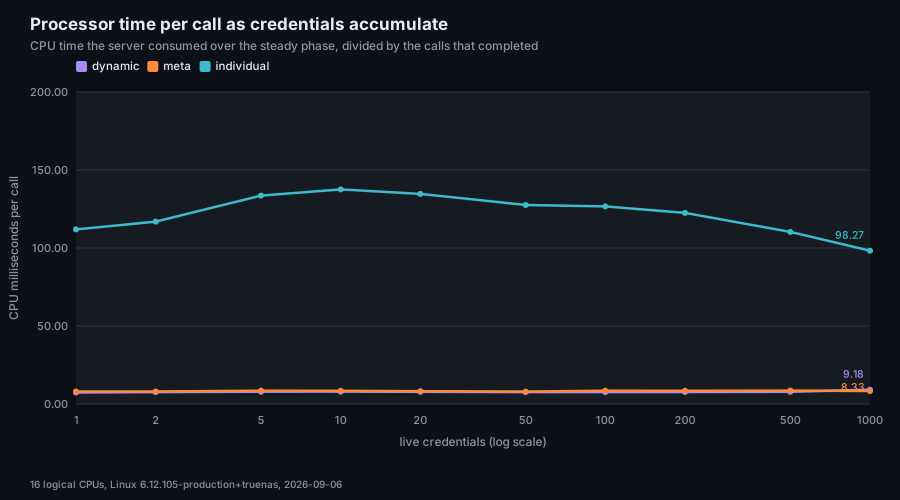
| 1000 | 897 | 1454 | 88.3 | 288 | 9.176 | 16119 | 3106 | 8857 | 2216 | 6357 | 4015 |
Fitted across these steps: the peak resident set under load grows 1.92 MiB per credential, and the settled live heap, read with the load stopped and a collection forced, grows 50.6 KiB per credential. The first is what a credential costs while it and every other one is calling; the second is what it costs to hold. The settled resident set lags both, because Go returns freed pages to the operating system on its own schedule. Every planned step ran, up to 1000 credentials.
http, meta surface: 4 in flight per credential, 10 s per step
Section titled “http, meta surface: 4 in flight per credential, 10 s per step”| Credentials | Resident, mean | Resident, peak | Settled heap | Settled resident | CPU per call | Calls | tools/call p50 | tools/call p99 | tools/list p50 | tools/list p99 | Goroutines |
|---|---|---|---|---|---|---|---|---|---|---|---|
| 1 | 134 | 146 | 32.6 | 93.0 | 8.014 | 6323 | 0.97 | 4.0 | 11 | 16 | 20 |
| 2 | 162 | 179 | 32.7 | 94.7 | 8.001 | 9544 | 1.4 | 5.3 | 15 | 20 | 24 |
| 5 | 185 | 203 | 32.8 | 94.7 | 8.512 | 10810 | 6.9 | 20 | 29 | 49 | 36 |
| 10 | 199 | 226 | 33.1 | 96.0 | 8.489 | 11025 | 16 | 53 | 51 | 117 | 56 |
| 20 | 232 | 257 | 33.6 | 100 | 8.234 | 11486 | 34 | 146 | 91 | 247 | 96 |
| 50 | 298 | 388 | 35.2 | 107 | 7.953 | 12021 | 138 | 451 | 165 | 530 | 216 |
| 100 | 295 | 406 | 37.9 | 116 | 8.517 | 11842 | 349 | 775 | 348 | 700 | 416 |
| 200 | 376 | 531 | 43.2 | 135 | 8.458 | 12427 | 747 | 1481 | 648 | 1250 | 816 |
| 500 | 514 | 689 | 59.5 | 184 | 8.599 | 14008 | 1414 | 3252 | 1763 | 3077 | 2015 |
| 1000 | 749 | 1009 | 83.5 | 243 | 8.330 | 16130 | 1791 | 6808 | 3180 | 6028 | 4015 |
Fitted across these steps: the peak resident set under load grows 0.81 MiB per credential, and the settled live heap, read with the load stopped and a collection forced, grows 52.6 KiB per credential. The first is what a credential costs while it and every other one is calling; the second is what it costs to hold. The settled resident set lags both, because Go returns freed pages to the operating system on its own schedule. Every planned step ran, up to 1000 credentials.
http, individual surface: 2 in flight per credential, 10 s per step
Section titled “http, individual surface: 2 in flight per credential, 10 s per step”| Credentials | Resident, mean | Resident, peak | Settled heap | Settled resident | CPU per call | Calls | tools/call p50 | tools/call p99 | tools/list p50 | tools/list p99 | Goroutines |
|---|---|---|---|---|---|---|---|---|---|---|---|
| 1 | 273 | 296 | 88.1 | 186 | 111.908 | 262 | 1.1 | 4.9 | 151 | 268 | 18 |
| 2 | 296 | 338 | 88.3 | 183 | 116.938 | 480 | 1.1 | 6.9 | 164 | 201 | 20 |
| 5 | 429 | 530 | 88.4 | 191 | 133.564 | 766 | 1.3 | 11 | 262 | 291 | 26 |
| 10 | 538 | 673 | 88.5 | 194 | 137.591 | 855 | 17 | 61 | 454 | 593 | 36 |
| 20 | 731 | 1073 | 88.8 | 200 | 134.659 | 953 | 38 | 257 | 784 | 1319 | 56 |
| 50 | 1081 | 1303 | 89.7 | 211 | 127.568 | 1110 | 68 | 804 | 1685 | 3502 | 116 |
| 100 | 1266 | 1724 | 91.1 | 215 | 126.672 | 1292 | 213 | 2572 | 2828 | 7144 | 216 |
| 200 | 2244 | 3274 | 94.0 | 248 | 122.502 | 1499 | 239 | 3428 | 5430 | 12328 | 415 |
| 500 | 2522 | 3427 | 103 | 277 | 110.330 | 2361 | 285 | 11643 | 11082 | 18163 | 1015 |
| 1000 | 3330 | 4677 | 117 | 326 | 98.265 | 3637 | 4974 | 16559 | 16796 | 25229 | 2015 |
Fitted across these steps: the peak resident set under load grows 4.27 MiB per credential, and the settled live heap, read with the load stopped and a collection forced, grows 29.8 KiB per credential. The first is what a credential costs while it and every other one is calling; the second is what it costs to hold. The settled resident set lags both, because Go returns freed pages to the operating system on its own schedule. Every planned step ran, up to 1000 credentials.
Sizing a deployment
Section titled “Sizing a deployment”stdio. One process per client, and the process builds its catalog as soon as it starts, so there is no idle state to save memory in. Between 106 and 277 MiB per process depending on the surface, with peaks under load a little higher. Nothing is shared between processes, so the cost is a straight line in the client count: a developer machine running one client will not notice, and the “all clients” column is what eight of them weigh together.
HTTP. Start from 35 to 38 MiB for a process serving nobody, then add one
catalog per distinct configuration, built by the first credential that asks
for it and shared by every other credential of that configuration: the server
is built once per configuration shape
(ADR-0020),
so what a credential holds is its client, its rate-limit bucket, its listen
counter and its watchers. That is
what the “per extra client” column reports: 0.15, 0.09 and -0.53 MiB on
dynamic, meta and individual, which is nothing above the noise of a
resident-set reading, across a ladder that admits 64 credentials one at a
time. What is left to size for is the concurrent work, which is the peak
column beside it: 324 to 1422 MiB with all 64 calling.
There are two axes, and only one of them is the pool. Holding a credential
costs 50.6 KiB of settled live heap on dynamic, 52.6 KiB on meta and 29.8
KiB on individual, so a thousand admitted credentials add 49, 51 and 29 MiB,
for a settled live heap of 88.3, 83.5 and 117.4 MiB and a settled resident set
of 0.28, 0.24 and 0.32 GiB. Serving them is
where an instance runs out: with every credential holding two to four requests
in flight, the peak resident set grows 1.92, 0.81 and 4.27 MiB per credential,
and at the thousand-credential step it stood at 1.4, 1.0 and 4.6 GiB.
A practical rule for HTTP: budget for concurrent callers, at 1 to 4 MiB
each depending on the surface, on top of 40 MiB for the process and one
catalog per configuration. --max-http-clients bounds pooled credentials and
is not a memory setting: at 50 KiB each, its default of 100 is five mebibytes.
Shorten --pool-idle-timeout if you want entries reclaimed sooner, but expect
the memory back in kilobytes rather than gigabytes: what the timeout still
bounds is the live GitLab clients and watchers an entry holds.
There is no floor, only a client count. “512 MiB is enough” is the shape of advice this page cannot give on its own, because any fixed figure has a number of concurrently calling credentials hidden inside it. Read the peak column of the scenario or series step that matches your surface and your expected concurrency, and give the container that plus a margin for the pages Go has not returned yet. Sizing a Deployment does that arithmetic for twenty, a hundred and a thousand callers at once.
Throughput. In the series, the calls completed per ten-second step climb
steeply up to about five credentials on dynamic and meta and slowly after
it: a call costs about 8 ms of processor time, so the host’s threads are the
ceiling. On dynamic the step completes 13,684 calls at five credentials,
about 1,370 a second, and 16,777 to 17,851 between fifty and two hundred,
roughly 1,700 to 1,800 a second, which at 7.6 to 7.7 ms a call is about
thirteen to fourteen of the sixteen threads; on meta it completes 10,810 at
five and 11,000 to 12,400 from ten to two hundred. Latency past that point is
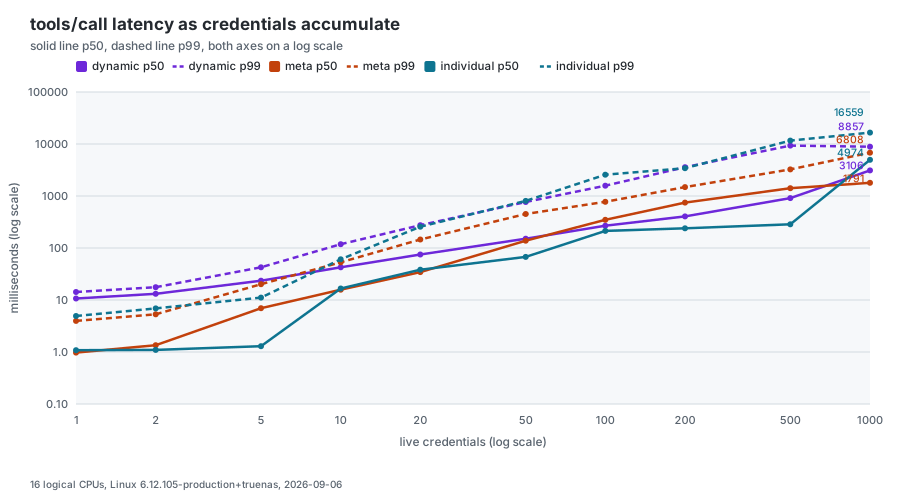
queueing, with the p50 of tools/call on dynamic climbing from 11 ms at one
credential to 269 ms at a hundred and 3.1 seconds at a thousand. individual is a
different shape: a tools/call costs about a millisecond, but a call there
averages 120 ms of processor time, because every second call is a tools/list
serialising three megabytes of schemas, so a single credential with two
requests in flight already keeps three cores busy, and its tools/list p50 is
151 ms before any contention exists at all.
A step at the top of the ladder outlasts its ten seconds, which is worth
knowing before dividing the call count by the step duration. A worker finishes
the call it has in flight rather than abandoning it, and at the last steps one
call takes tens of seconds: individual at a thousand credentials completed
3,637 calls at 98.3 ms of processor time each, which is 357 core-seconds and
cannot fit in ten seconds of a sixteen-thread host. The per-call figures are
sound, because both sides of the division come from the same window; the
window is simply longer than the step duration names.
Where the memory that grows with the credential count actually goes, read from the heap and CPU profiles the series writes, is worked through in Resource Hot Spots, which also keeps the history this page does not.
What a client waits for
Section titled “What a client waits for”The process is ready in milliseconds and the surface behind it is not. On HTTP
/health answers in 51 to 59 ms while the pool holds nothing; the first
credential of a configuration builds its catalog, and that is where the wait
is: 0.32 seconds on dynamic, 0.32 on meta and 1.28 on individual on the
host measured. On stdio the process is executed in well under a millisecond and
starts building immediately, so its first request waits on the same work, at
0.35, 0.34 and 1.28 seconds.
That wait is per configuration rather than per credential, since the built
server is shared, and it is paid once per configuration for the life of the
process: a configuration’s server is dropped only when its registration fails
(ADR-0020,
NEG-004), never because its entries were reclaimed. A credential arriving after
--pool-idle-timeout or the pool’s size bound took its entry pays only its own
entry build, the credential probe, the tier and the scopes, and then a warm
listing. Two consequences: a client that gives up before its first call answers
has not hit a hung server, and an HTTP deployment pays the wait once per
configuration, not once per entry reclaimed.
Once warm, the picture inverts. A tools/list costs 1.9 to 21 ms on dynamic,
42 to 270 ms on meta and 0.38 to 2.4 seconds on individual, which is the
cost of serializing 12 KB, 599 KB and 3.2 MB respectively, the higher end of
each pair being HTTP with all 64 credentials calling. A client speaking
protocol 2026-07-28 may serve repeat listings from its own cache and pay this
less often, but it pays it at least once per session.
Telemetry
Section titled “Telemetry”Exporting over OTLP costs a handful of goroutines and measurable processor time, and no material memory. It is off by default; see OpenTelemetry for what it exports and where it goes.
What this does not measure
Section titled “What this does not measure”- A real GitLab. Every tool call answered here is answered on loopback, so the latency figures are the server’s own overhead with the instance’s contribution removed. Add your own instance’s round trip to them.
- A client’s cache. The published
tools/listlatency is what the server spends, not what a 2026-07-28 client waits for on a repeated call. - Anything but this machine. One host, one operating system, one Go toolchain, all named in the generated text above. The shape of the numbers should carry to other machines; the absolute values will not.
- Disk and network. Nothing here writes to disk in the hot path, and the only network is loopback.
- Pool evictions. The series sizes the pool to its largest step, so none
happen, and the counters it records say so by construction. What an evicted
and rebuilt entry costs is the cold
tools/listthe ramp measures. - The driver’s own load. The driver and the server share the host, and at a thousand credentials the driver is reading thousands of responses a second. The server’s figures are its own (resident set and processor time are read per process), but the latencies include whatever the driver added by being busy.
Reproducing
Section titled “Reproducing”make bench-resources # measure, then redraw everythingmake bench-resources-render # redraw from the committed record, no measuringmake check-bench-resources # verify the charts and tables match the recordThe eight point scenarios take five to ten minutes on the reference host: the stdio half spends most of it building one catalog per process, which is the cost being measured rather than overhead of the harness, and the HTTP half spends it serving 64 credentials at once. The series then take as long as the host’s memory lets them, up to a quarter of an hour per surface where a thousand credentials fit, less where the budget stops them earlier. For a faster check while changing the harness itself, measure a smoke matrix into a record of its own and draw nothing:
go run ./cmd/bench_resources/ -quick -json /tmp/bench.json \ -profiles /tmp/bench-profiles -no-renderA partial matrix refuses to write to the published record: replacing measured
numbers with a smoke test would leave the documentation presenting them as the
figures. A -clients list of your own is partial for the same reason.
Measuring on one host, rendering on another
Section titled “Measuring on one host, rendering on another”The series at 500 and 1000 credentials needs tens of gigabytes, which is not always the machine the documentation is written on. The driver therefore has a measure-only mode that reads nothing from the repository. Build both binaries in a checkout, copy them to the host that has the memory, and run:
go build -o dist/bench_resources ./cmd/bench_resourcesgo build -o dist/gitlab-mcp-server ./cmd/server
# On the measuring host, with no Go toolchain and no checkout:./bench_resources -binary ./gitlab-mcp-server \  -json /var/tmp/bench/resource-benchmark.json \  -profiles /var/tmp/bench/profiles \  -no-render
Then copy the record back over site/src/data/resource-benchmark.json and
redraw from it with make bench-resources-render; the profiles stay on the
measuring host, or beside the record under bench/profiles/, which git
ignores. Two things about the measuring host: the driver and the server each
hold one socket per request in flight, so at a thousand credentials with four
in flight each the open-file limit has to allow several thousand descriptors
(Go raises the soft limit to the hard one on its own, so ulimit -Hn is the
figure to check); and the budget is read from the host’s available memory when
the run starts, so stop whatever else is using it first, or pass
-memory-budget explicitly.
The held mode
Section titled “The held mode”-held <counts> measures the other shape of request: one the server holds open
because GitLab has not answered. It is the measurement the
held-call ceiling
was sized from. Every other mode drives requests the server answers as fast as
it can, so none of them sees what a held call costs or what a process holding
too many does. The stand-in GitLab holds every project read a step sends it,
headers first (the server gives GitLab a minute to answer with headers, and
would abandon and resend a read held before them), so each step is a known
number of calls to the dynamic surface’s gitlab_execute_action running
project.get, spread round robin across -held-credentials, held at once and
sampled while they are held.
A step is sampled once every call it offered is either held at the stand-in or
has come back, or once that count has stopped moving for three seconds (a
process out of descriptors accepts no more connections, so some calls are
neither), or after two minutes. The sample is the process’s open descriptors
(Linux only, from /proc/<pid>/fd; elsewhere recorded as unknown with a note),
its goroutines and live heap from the profiling listener, its resident set, and
a /health probe on a connection of its own, since a probe riding an old
keep-alive connection would answer for a process that no longer accepts one.
Each step then releases the hold and files every call as served, refused (a
503, the status the held-call ceiling answers a 2026-07-28 client with, its
first text kept) or failed, and prices one held call as the step’s growth over
the idle process divided by the calls held.
-held-nofile <n> starts the server through
/bin/sh -c 'ulimit -n "$0" && exec "$@"', which sets the soft and the hard
limit together and puts the server in the shell’s place, so the process sampled
is the server. Setting the hard limit is the point: the Go runtime raises the
soft limit to the hard one before the server starts, so lowering only the soft
limit would measure nothing. The server sizes its held-call ceiling from that
limit, 192 under 1024. The mode writes bench/held.json, which is not
committed, draws nothing, and is refused if -held-json names the published
record. make bench-held runs the ladder the ceiling was measured with, under a
limit of 1024.
| Flag | Type | Default | Description |
|---|---|---|---|
-held | string | "" | Comma-separated counts of calls held open at once, ascending; empty runs the matrix |
-held-credentials | int | 1 | Credentials the calls are spread across |
-held-nofile | int | 0 | Descriptor limit the server is started under; 0 inherits this process’s (not on Windows) |
-held-json | string | bench/held.json | Document to write; refused if it names the published record |
# What a held call costs, and what the process does past a descriptor limitgo run ./cmd/bench_resources/ -held 100,192,250,500,1000,2000,4000 -held-nofile 1024go run ./cmd/bench_resources/ -held 100,192,250,500,1000,2000,4000 -held-nofile 1024 -held-credentials 100The sessions mode
Section titled “The sessions mode”-sessions <counts> measures what the stateful transport keeps: a session. It
is the measurement the
session ceiling
was sized from. The server is started with --stateless=false, and each step
opens a known number of sessions at once, spread round robin across
-sessions-credentials, each an initialize on protocol 2025-11-25 followed by
notifications/initialized. With -sessions-stream, every session also opens
its standalone stream, the GET a stateful client holds open for the server’s
notifications, and keeps it open for the step. Before the first step each
credential opens a session, lists its tools and deletes it, so the pool holds a
built entry for every credential and the entry is not priced as part of the
sessions.
A step is sampled the way a held step is (the same settling rule, the same
figures, the same /health probe on a connection of its own), while every
session it opened sits idle. It then pings every session the server gave an id,
each ping waiting no longer than the /health probe does, and counts the ones
that answered: that is the number of sessions the server holds, seen from
outside, and the count stops at the first ping that got no answer at all, since
a process that accepted no connection will not accept the next. Every open is
filed as opened, refused (a 503, the status the session ceiling answers with,
its first text kept) or failed, one session is priced as the step’s growth over
the idle process divided by the sessions open at the sample, and every stream
is closed and every session deleted before the next step.
-sessions-nofile <n> starts the server under a descriptor limit exactly as
-held-nofile does. The server sizes its session ceiling from the held-call
ceiling that limit gives it, 96 under 1024. The mode writes
bench/sessions.json, which is not committed, draws nothing, and is refused if
-sessions-json names the published record; it cannot be combined with -held
or -fairness. make bench-sessions runs the ladder the ceiling was measured
with, under a limit of 1024 and with every session’s stream open.
| Flag | Type | Default | Description |
|---|---|---|---|
-sessions | string | "" | Comma-separated counts of sessions open at once, ascending; empty runs the matrix |
-sessions-credentials | int | 1 | Credentials the sessions are spread across |
-sessions-nofile | int | 0 | Descriptor limit the server is started under; 0 inherits this process’s (not on Windows) |
-sessions-stream | bool | false | Open each session’s standalone stream and hold it open for the step |
-sessions-json | string | bench/sessions.json | Document to write; refused if it names the published record |
# What a stateful session costs, with and without its standalone streamgo run ./cmd/bench_resources/ -sessions 100,500,1000,2000,4000go run ./cmd/bench_resources/ -sessions 50,96,100,500,1000,2000,4000 -sessions-nofile 1024 -sessions-streamThe rest of the command’s flags, and the fairness mode, are in the command reference.